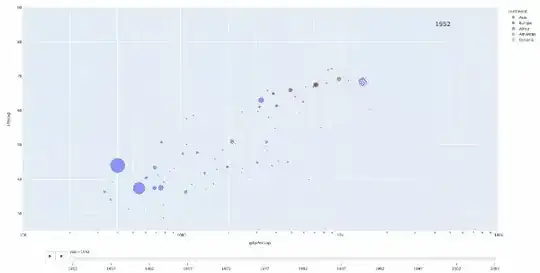
When you create a figure using animations in plotly, each trace is stored in a frame, and a tuple of all of the frames are stored in fig.frames. What we can do is add a go.Scatter trace to each frame with text in the upper right corner of your figure that corresponds to the year – and since we supplied the argument animation_frame="year", each frame in fig.frames has the property "name" equal to the year.
import plotly.express as px
import plotly.graph_objects as go

df = px.data.gapminder()
fig = px.scatter(df, x="gdpPercap", y="lifeExp", animation_frame="year", animation_group="country",
           size="pop", color="continent", hover_name="country",
           log_x=True, size_max=55, range_x=[100,100000], range_y=[25,90])

## add the text as a trace to it shows up initially
fig.add_trace(go.Scatter(
    x=[45000],
    y=[85],
    text=fig.frames[0]['name'],
    mode='text',
    textfont=dict(size=20),
    showlegend=False,
))

## add the text to each individual frame
for frame in fig.frames:
    frame.data = frame.data + (
        go.Scatter(
            x=[45000],
            y=[85],
            text=frame.name,
            mode='text',
            textfont=dict(size=20),
            showlegend=False,
        ),
    )

fig.show()