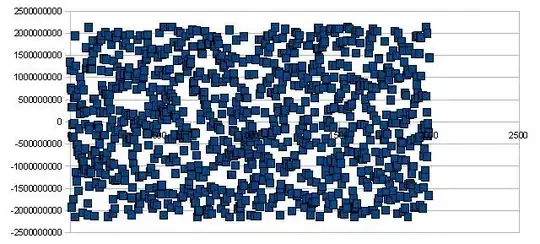
plt.show()
CC = []

fig, ax = plt.subplots(4,4,figsize=(8,8))
tau = 130

for n,img in enumerate(ls2):
    sel = img <= tau
    img[sel] = 0
    visited = img==0.0
    i_1 = n % 4
    j_1 = n//4
    if i_1<4 and j_1<4:
        img = ls2[i_1+ax.shape[0]*j_1]
        ax[i_1,j_1].imshow(img,cmap='gray')
    for i in range(img.shape[0]):
        for j in range(img.shape[1]):
            if visited[i,j]:
                continue # skip visited pixels
            ## for a grayscale image, this will be img[i,j,0]
            todo = set()
            todo.add((i,j))
            visited[i,j]=True
            # append a new connected component at i,j, maximum 0
            CC.append( (i,j,img[i,j]) )
            # inner loop(s): visit neighborhood
            while len(todo)>0:
                r,c = todo.pop() # get an element from the set
                # compute the valid "limits" of the neighborhood (edges of the graph)
                rl, rr = max(0,r-1), min(img.shape[0],r+2)
                cl, cr = max(0,c-1), min(img.shape[1],c+2)
                for this_row in range(rl,rr):
                    for this_col in range(cl,cr):
                        if visited[this_row,this_col]:
                            continue
                        todo.add((this_row,this_col))
                        visited[this_row,this_col]=True
                        if img[this_row,this_col]>CC[-1][2]:
                            # found a new maximum
                            CC[-1] = (this_row,this_col,img[this_row,this_col])

x = [r for r,c,val in CC]
y = [c for r,c,val in CC]
vals = [val for r,c,val in CC]
plt.scatter(y,x)

plt.show()
In the given image, I am trying to find the maxima and put a point on each of them (the white spots). But all of the dots get put on the last image. Can someone help?
x = [r for r,c,val in CC]
y = [c for r,c,val in CC]
vals = [val for r,c,val in CC]
plt.scatter(y,x)
I tried to indent this block inside the loop. But it doesn't work.
