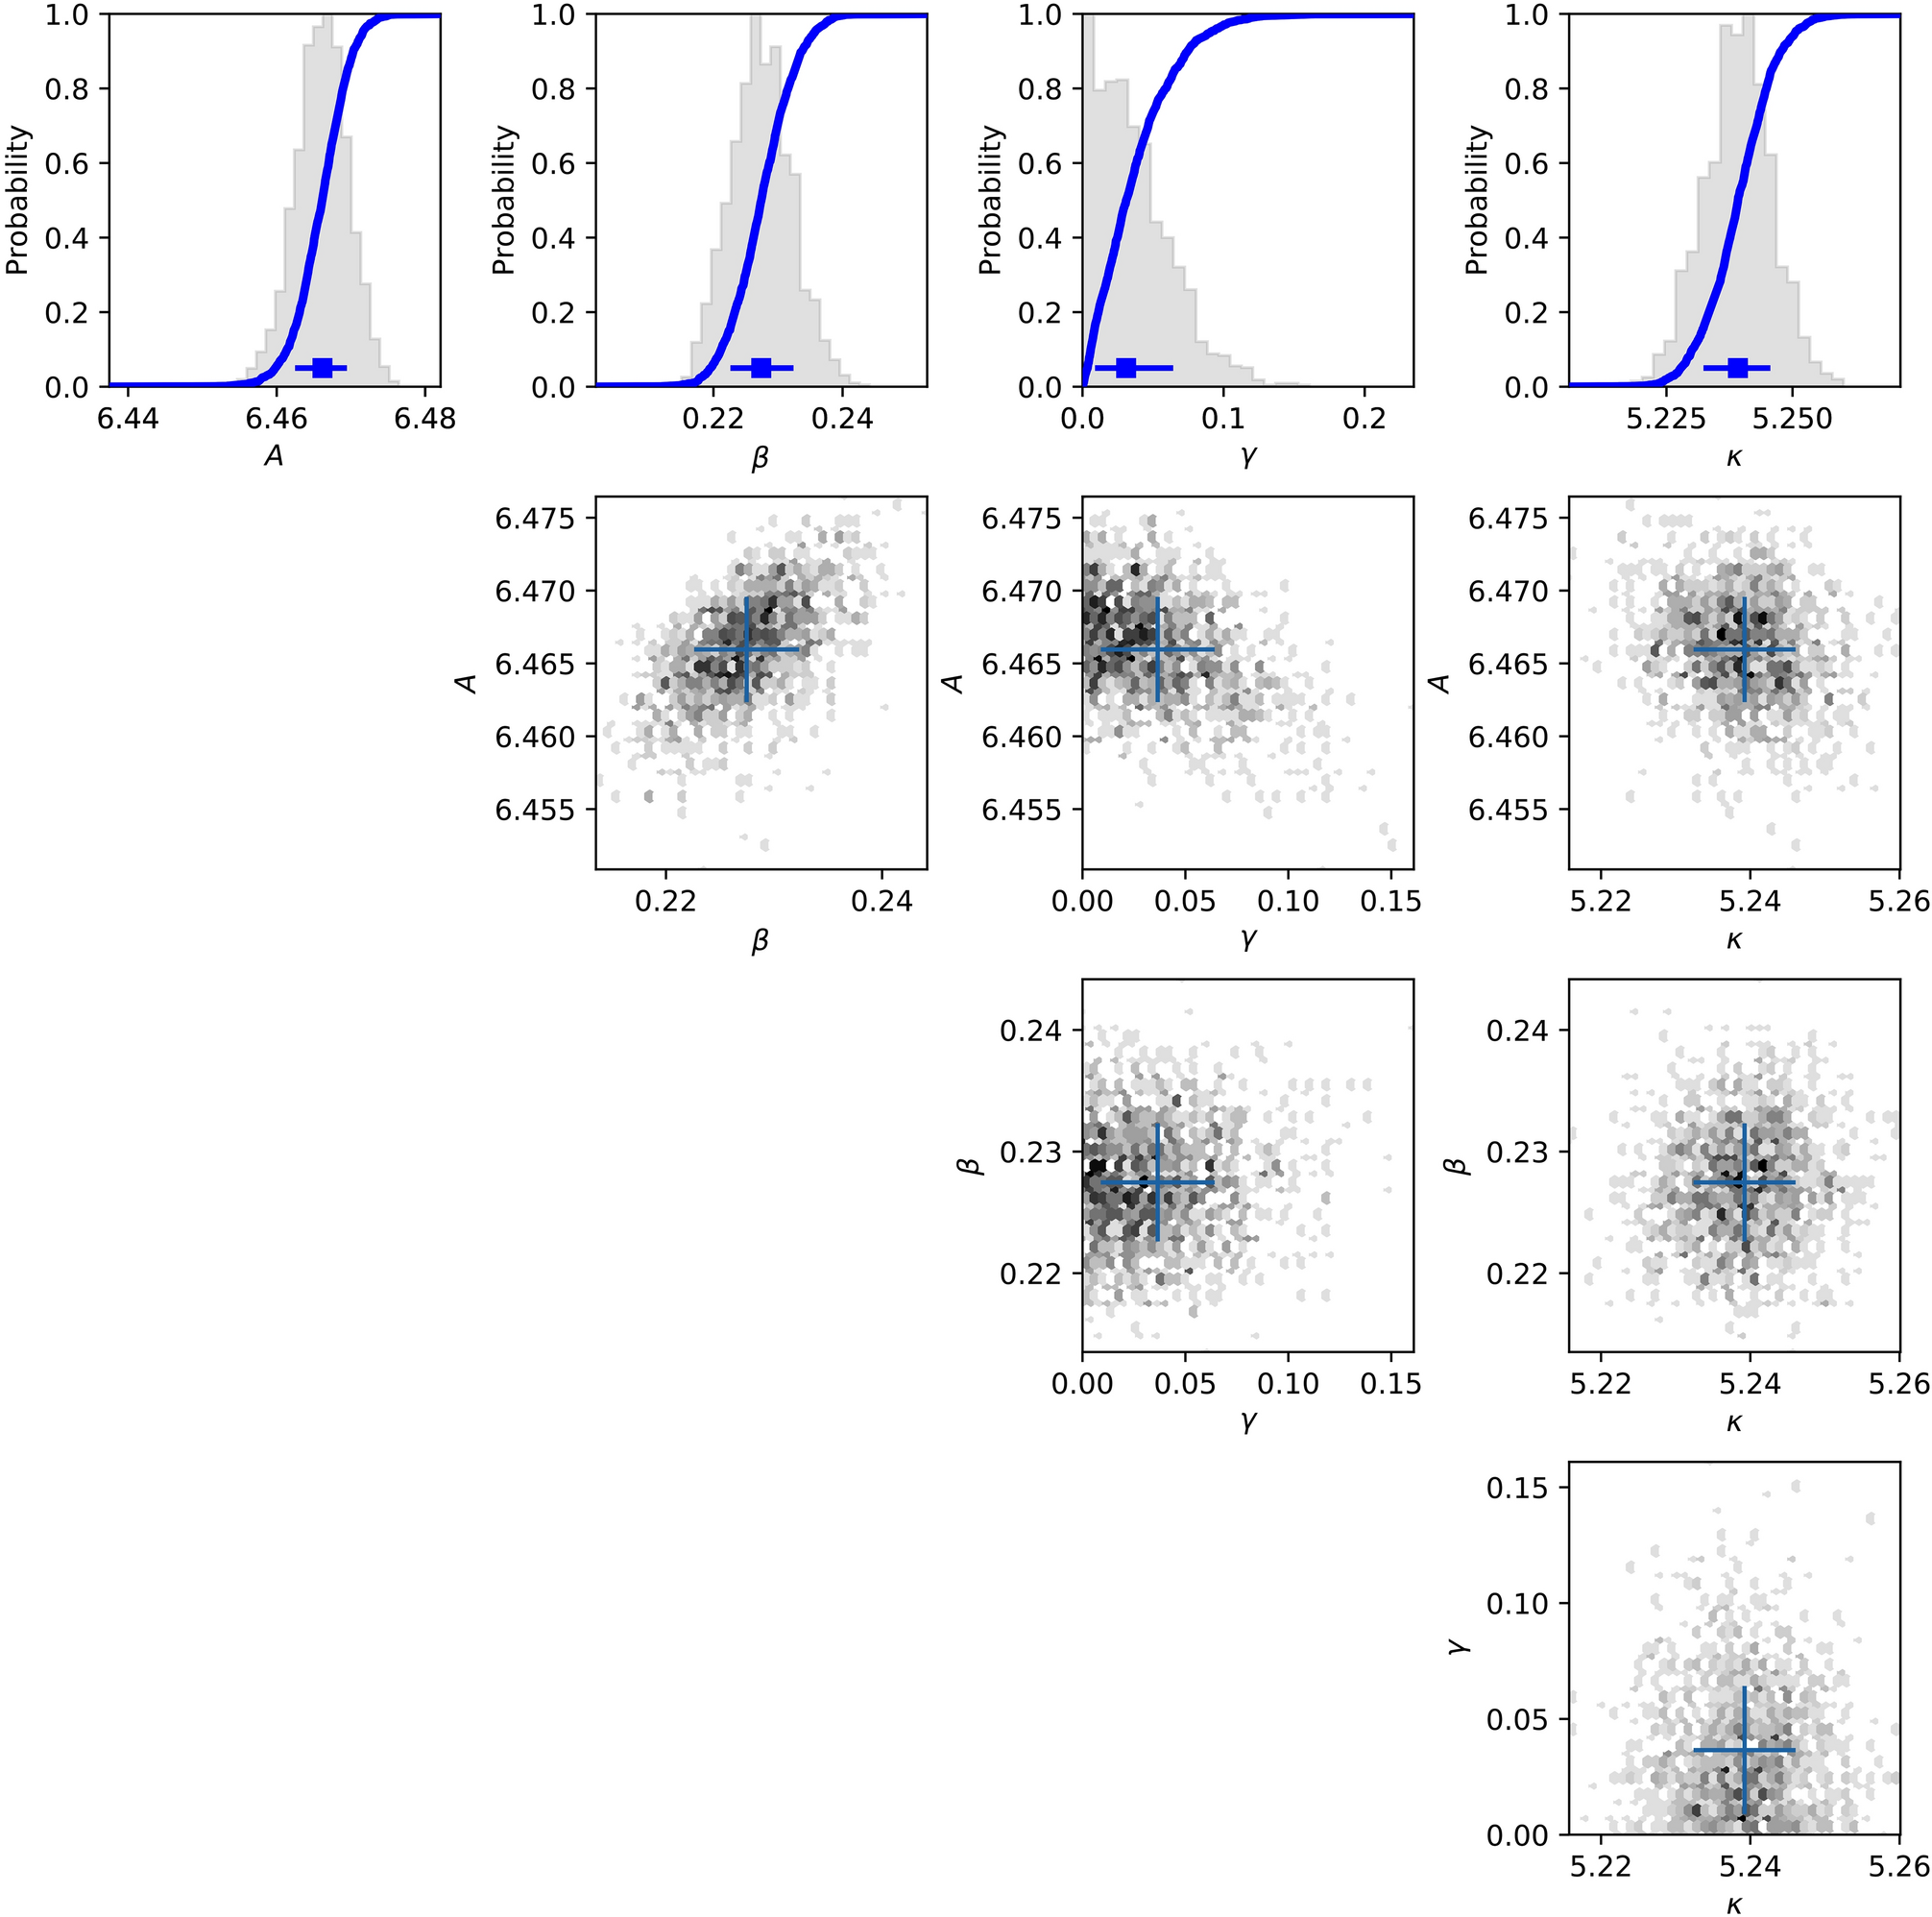
I have a corner plot with posterior probability distributions subplots from a minimisation function. on the x and y axis I have my different parameters, and then the contour hex plot is the distribution.
plt.subplot(n_params, n_params, n_params * (j + 1) + i + 1)
            p.plot_conditional(i, j, bins='log', xscale='log', yscale='log', cmap = plt.cm.gray_r)
            for m in modes:
                plt.errorbar(x=m['mean'][i], y=m['mean'][j], xerr=m['sigma'][i], yerr=m['sigma'][j])
            plt.xlabel(parameters[i])
            plt.ylabel(parameters[j])
(for details not relevant to this Q, plot_conditional is from the pymultinest library. )
the p.plot_conditional corresponds to plt.hexbin(x=values[:,dim1], y=values[:,dim2], gridsize=grid_points, reduce_C_function=numpy.nansum, **kwargs) function, but to simplify it is my x and y variables a hexbin plot.
My plots look something like this, but with different data, and the 2D plots are on a log-log scale, as indicated by xscale='log', yscale='log' in my plt.subplot().
However, when I try to plot the plt.errorbar(), the errorbar points appear at different points than expected, and not aligned with the correct value showin in the first layer of histograms (see pic linked under "this").
How can I correct this?