I created stored procedure in my Azure PostgreSQL with a warning like below:-
CREATE OR REPLACE PROCEDURE my_proc(schema_name TEXT)
LANGUAGE plpgsql
AS $$
BEGIN
  RAISE WARNING 'my_proc executed for schema %', schema_name;
  -- add your procedure logic here
END;
$$;

CALL my_proc('my_schema');

Sent the data to Log Analytics workspace like below:-
I checked the logs in Azure Postgresql > Left pane > logs section and ran this query but no logs on Stored procedure were present as default Diagnostic logs deals with the Azure PostgreSQL connections and error metrics in authenticating to the Azure Postgre SQL:-
AzureDiagnostics
| where Category == "PostgreSQLLogs"
| where Message contains "my_proc executed for schema"
No output:-
I tried to inspect AzureDiagnostics table to fetch the Stored Procedure data but did not find any, You can also inspect each and every column from the table in left to right. Refer below:-

As stored procedure falls under audit logs, You need to enable Azure PostgreSQL Pgaudit extension to view the audit logs like below:-
Run this command to check if Pgaudit extension is loaded from shared library in your server like below:-
show shared_preload_libraries;
CREATE EXTENSION pgaudit;


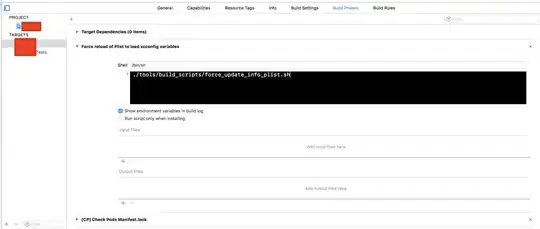
Now, Go to server parameters> Search for pgaudit and add WRITE permission to pgaudit.log
Now, I went to my Log analytics workspace where my diagnostics logs are sent and ran the below query to get the Procedure log and received the Warning message in the table output refer below:-
AzureDiagnostics
| where Category == "PostgreSQLLogs"
| where Message contains "my_proc"
Note- For the warning to reflect wait for some time after the pg audit extension is enabled and the warning is raised again.
As per your comment:- In order to understand all the columns designation of the table, Export the query as a CSV(all columns) and inspect the Excel csv sheet like below:-
https://i.stack.imgur.com/BDzxQ.png
https://i.stack.imgur.com/1T6Nz.png
https://i.stack.imgur.com/RBLNU.png
Reference:-
Audit logging - Azure Database for PostgreSQL - Flexible server | Microsoft Learn
 , but, the logs after I run the query, output nothing:
