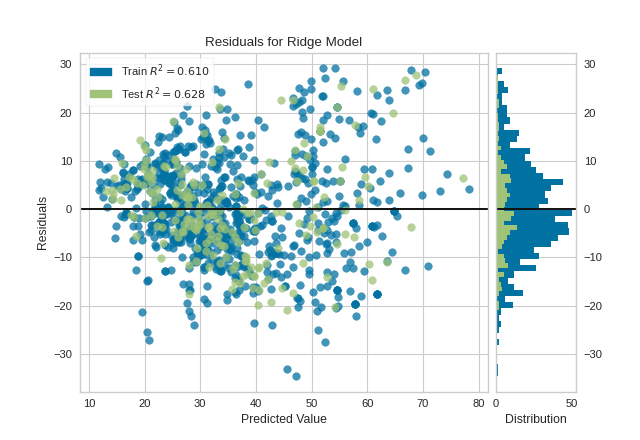
I am doing a residuals plot in yellowbrick, the code could be the same
from sklearn.linear_model import Ridge
from sklearn.model_selection import train_test_split
from yellowbrick.datasets import load_concrete
from yellowbrick.regressor import ResidualsPlot

X, y = load_concrete()
X_train, X_test, y_train, y_test = train_test_split(X, y, test_size=0.2, random_state=42)
model = Ridge()
visualizer = ResidualsPlot(model)
visualizer.fit(X_train, y_train)  # Fit the training data to the visualizer
visualizer.score(X_test, y_test)  # Evaluate the model on the test data
visualizer.show()                 # Finalize and render the figure
Obtaining:
https://www.scikit-yb.org/en/latest/api/regressor/residuals-1.png
I can customize the graph on the left, but how can I customize the graph on the right? Font type and size, axis title and marks.
I don't know how to access it.