1.- No data, no way way to tell : CAPTURE TF SAMPLES
Mathworks is encouring the usage of handles, but direct modification of options in the input field is a MATLAB feature, so work has been put to keep both ways to do the same without conflict.
For this particular question, the following odd thing happens :
close all;clear all;clc

s = tf('s');
G = (1.5791e08*s^2)/((s+1.257e04)^2*(s^2 + 62.83*s + 987))

op1 = bodeoptions;
op1.Title.String = {["Bode Diagram For Designed Components"]}
op1.FreqUnits = 'Hz';
op1.Grid = 'on';
op1.PhaseVisible='off'
figure;
bode(G) % same as bode(G,op1)
The previous 2 lines work ok.
However G are needed, so when one attempts to pull such values, like for instance with the following
figure
[Gmag,Gph,wout]=bode(G);
empty graph, not even the axes.
The following doesn't work either
figure
[Gmag,Gph,wout]=bode(G,op1);
again empty.
Don't ask me why but when calling bode twice, like this
figure
bode(G)
[Gmag,Gph,wout]=bode(G,op1);

Now it again works.
The bode plot is obtained AND the transfer function samples are also captured.
Yet bode is still ignoring both the option I added to keep phase off
and your option to switch grid on.
Bode has been around since early versions of MATLAB. My guess would be bode bodeplot are mainly used in academia, and not that often comparing to directly working with G therefore no update has been done for a while.
Gmag Gph size check
size(Gmag)
size(Gph)

 =
     1     1    94
 =
     1     1    94
Again, another odd thing : Gmag Gph show up 3D despite both are actually 1D.
And the following doesn't work either.
op1.Grid = 'on';
op1.PhaseVisible='off'
2.- Not enough frequency resolution
Without G values the only way to find the 1dB bandwidth or 3dB, or whatever cut-off amplitude value you choose to decide how much pass band to be considered signal and what to be considered off band is using the 'markers' directly on the graph in the same way we do when working on measurement instruments like oscilloscopes, spectrum analysers and network analysers.
MATLAB allows multiple markersv on same graph curve, calling then DATA TIPS.
Let's say you are looking for the -1dB bandwidth, same as cut-off at -1dB from the pass band peak.
One can visually tell that the sought peak is not far from 0dB.
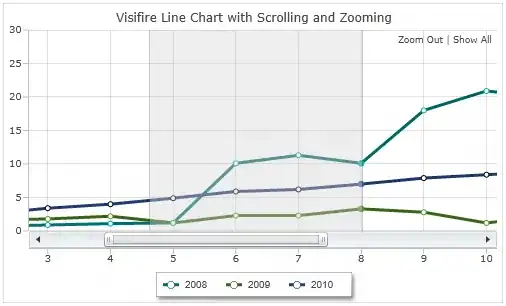
Look at the reading of 2 adjacent markers right around -1dB
If +17% -19% is ok to you just go ahead with the default input frequencies but the chances are you need better amplitude resolution.
To such purpose one has to use a higher density of frequencies, and the way
do that is to define more input frequencies than the default amount, in this case 94
close all;

op1 = bodeoptions;
op1.Title.String = {['Bode Diagram For Designed Components']}
op1.FreqUnits = 'Hz';
op1.Grid = 'on';
op1.PhaseVisible='off';

fin=[1:1e2:1e5];  % [Hz]

figure
bode(G,op1)
ax=gca
hold(ax,'on')
[GmagdB,Gph,fout]=bode(G,fin,op1);

GmagdB=squeeze(GmagdB);
Gph=squeeze(Gph);
As asked there were 94 input frequencies, now you have 1e3 frequencies, but squeeze is needed to remove void dimensions because bode, for whatever reason, produces 1x1xN values, not just 1xN.
3.- Expected 1dB bandwidth
manually one can check expected results :
4.- Simplify : work directly on G
and despite having the graphic handle, plot cannot direct the new trace onto the generated graph.
fin=[0:10:1e7];
G2 = (1.5791e08*(2*pi*fin*1j).^2)./((2*pi*fin*1j+1.257e04).^2.*((2*pi*fin*1j).^2 + 62.83*(2*pi*fin*1j) + 987));

G2magdB=10*log10(abs(G2));
n=find(G2magdB>-10);

figure
ax2=gca
plot(ax2,fin,G2magdB)
hold(ax2,'on')
grid on
xlabel('f[Hz]');ylabel('|G| [dB]');
plot(ax2,fin(n),G2magdB(n),'r*')
axis([0 .5e6 -35 1.5])


5.- ** bode ** and ** bodeplot ** are slow
bode and bodeplot are useful functions but both are slow compared to working directly the the available data.
This G is not a really sharp filter.
Also the transfer function looks like a LPF but there's a notch when really close to 0Hz.
Do you really want DC through? Perhaps not the best choice of filter.


