0

I am trying to plot a histogram with the proportion of the class (0/1) for each bin.

I have already plotted a barplot with stacked percentage (image below), but it doesn't look the way I want to.

Stacked percentage barplot

1

I want something like this (it was on this post, but it is coded in R, I want it in python), and if possible, using the seaborn library:

Stacked percentage histplot

2

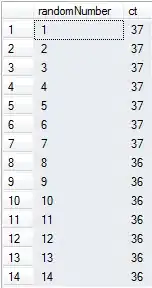
My dataset is super simple, it contains a column with the age and another one for classification (0/1):

df.head()

[dataset

3

Trenton McKinney
  • 56,955
  • 33
  • 144
  • 158
cogno.luis
  • 53
  • 6

1 Answers1

0

With seaborn, you can use sns.histplot(..., multiple='fill').

Here is an example starting from the titanic dataset:

from matplotlib import pyplot as plt
from matplotlib.ticker import PercentFormatter
import seaborn as sns
import numpy as np

titanic = sns.load_dataset('titanic')
ax = sns.histplot(data=titanic, x='age', hue='alive', multiple='fill', bins=np.arange(0, 91, 10), palette='spring')
for bars in ax.containers:
    heights = [b.get_height() for b in bars]
    labels = [f'{h * 100:.1f}%' if h > 0.001 else '' for h in heights]
    ax.bar_label(bars, labels=labels, label_type='center')
ax.yaxis.set_major_formatter(PercentFormatter(1))
ax.set_ylabel('Percentage of age group')
plt.tight_layout()
plt.show()

sns.histplot filling to 100%

JohanC
  • 71,591
  • 8
  • 33
  • 66
  • Looks cool! Thank you for your answer. Also, I was trying to figure out how to write percentages on every group, so another thing solved! – cogno.luis Feb 17 '23 at 12:52