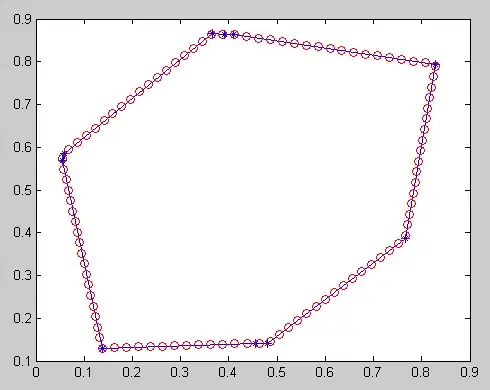
I want to display rectangles like in the image below with their real sizes (each rectangle has a length "dl" and a width "dw")

      ggplot() +
      ggtitle("top+bot") +

      geom_rect( data = grid, aes(xmin = grid["x"], xmax = grid["x"]+ grid["dl"],
                              ymin = grid["y"], ymax =grid["y"]+ grid["dw"],
                              fill = T, color = "blue"),
                              alpha = (gridtop$z/op)) })pe here
When I try to run this code, there is nothing displayed, do you know what the problem is?