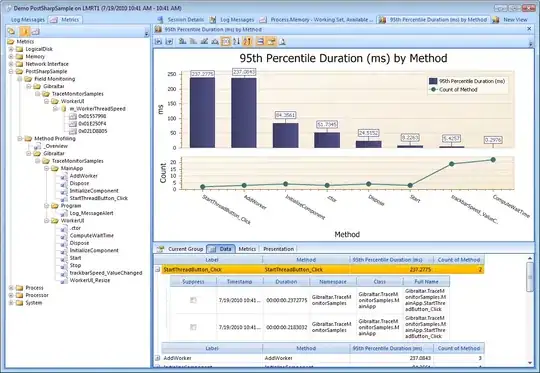
I have the following Loki query in Grafana:
sum(count_over_time({filename="/var/log/cron.log", instance="node01"} |= `ERROR` [$__interval]))
which gives
but I am at a loss trying to group the sum by day.
I tried various versions of sum by (grouping) (expr) but that usually ended in parsing errors. The docs don't seem very "all-encompassing".
I want a table that shows total sum or errors per day (in the given window).
