I'm trying to create a plot using QChart with python. I have so far managed to plot and to create an x- and y-axis, however they do not seem to correspond. I assume there is link between the chart, the axis and the series I'm missing. My self object is a chart.
My code:
        self.axis_x = QValueAxis()
        self.axis_x.setTitleText("Second")
        self.axis_x.setRange(0, 10)
        self.setAxisX(self.axis_x)
        self.addAxis(self.axis_x, Qt.AlignBottom)

        self.axis_y = QValueAxis()
        self.axis_y.setTitleText(str(template.primary_y_axis.unit))
        self.axis_y.setRange(0, 10)
        self.setAxisY(self.axis_y)
        self.addAxis(self.axis_y, Qt.AlignLeft)

        self.series = QLineSeries()
        p1 = QPoint(2, 0)
        self.series.append(p1)
        p2 = QPoint(2, 1)
        self.series.append(p2)
        p3 = QPoint(4, 2)
        self.series.append(p3)
        p4 = QPoint(6, 3)
        self.series.append(p4)
        p5 = QPoint(8, 4)
        self.series.append(p5)
        self.createDefaultAxes()
        self.series.attachAxis(self.axis_x)
        self.series.attachAxis(self.axis_y)
        self.series.setName("hei")
        self.addSeries(self.series)

        self.legend().setVisible(True)
The plot i am recieving:
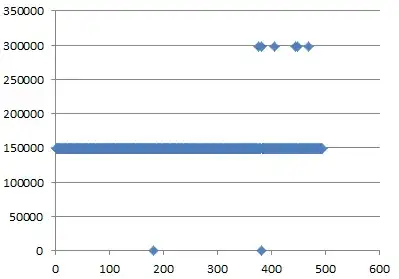
I have tried using QPoint to plot, and have also tried without. No difference.