4

I believe this question is significantly different from other, similar questions.

My flow is roughly this:

### Compile
%> gcc -ggdb3 file0.c ... -fno-builtin -c -o file0.o
%> gcc -ggdb3 file1.c ... -fno-builtin -c -o file1.o
...
%> gcc -ggdb3 fileN.c ... -fno-builtin -c -o fileN.o
### Link
%> gcc -ggdb3 -nostdlib -nodefaultlibs -Tscript.lds -Ttext=0x4000000 \
          -Wl,--build-id=none -o main.elf file0.o file1.o ... fileN.o
### Disassemble
%> objdump -Stsxd main.elf > main.dis

I do not see the C code between lines of the disassembly file produced by objdump. See the image below for an example.

I don't blame objdump, because objdump --dwarf=decodedline main.elf shows nothing. I don't think the information is in the elf file.

  • I've fiddled with adding -g, -ggdb, and -gdwarf of various versions.
  • I've put full pathnames to files instead of relative paths.
  • I've tried -O0 to -O3.
  • The only flags not shown in my flow above are -W, -D, and -I flags.

If it matters, I'm using the Linaro port of gcc 6.4.1 targeting Cortex-A72 clusters. (My build machine is CentOS 7.9 on x86_64.) The commands to gcc and objdump above are prefixed to use that gcc version, and I see its banner from the debug section of the ELF in the disassembly file.

Is there some flag I am missing, or perhaps something I am adding (like -fno-builtin, or -Wl,--build-id=none) that could cause this? Could my linker script file be stripping required information out, even though I provide a "debug" section (for .debug_info, .debug_line, and many other sections)? Both objdump and readelf show a significant number of bytes in the debug section. What do I look for, more specifically?


edit: I expect to see the kind of thing that is on the left of this image, but I see what is on the right: Image


edit2: This does produce embedded source lines in the output of all the files:

%> objdump -Stsxd file0.o > file0.dis
%> objdump -Stsxd file1.o > file1.dis
...
%> objdump -Stsxd fileN.o > fileN.dis

The information IS in the object files. Something about the way I am conducting a separate link is stripping it out...?

I switched to full/absoulte paths for all the object files in my link command. No joy.


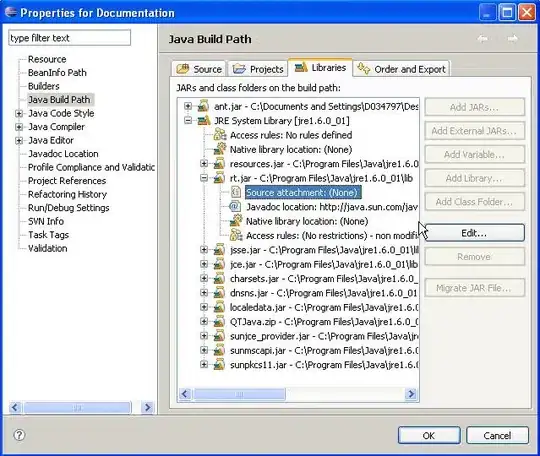
edit3: My custom linker script, given with -T and mentioned above as script.lds, has a debug section that looks like this: image of my debug sections

edit4:

By running with NO linker script, or by manually providing the DEFAULT linker script, I get the output I expect.

That shows the problem is my linker script.

By replacing my debug section with all of the debug symbols/sections from the default linker script, it still does not work. It is NOT a missing symbol. There is something else... Hmmm...

Here is the debug sections/symbols from the default linker script:default linker script file debug sections

edit5: Experiments suggested here showed that the problem was caused by the linker script. Adding sections that were in the default linker script, but not mine, was a good idea. It didn't fix it, but it was the right thing to do.

I did some cleanup, additions and deletions in the linker script, and it started working!

I cannot pinpoint what, exactly the problem was, and I realize how frustrating it is that I cannot post the full linker script...

Lance E.T. Compte
  • 932
  • 1
  • 11
  • 33
  • inline is only a hint to the compiler – pm100 Jan 13 '23 at 04:45
  • @pm100, I think you misunderstood my question entirely... I will add an example of what I see and what I expect to see. – Lance E.T. Compte Jan 13 '23 at 17:51
  • @KamilCuk, I took your suggestion and rephrased it... Thanks! I also don't see this problem in my many other environments. I wonder if this version of Linaro is broken. I don't know PRECISELY what to look for in the ELF to know if objdump will work... – Lance E.T. Compte Jan 13 '23 at 20:40
  • 2
    Check how the default linker script (`ld --verbose`) handles debug sections. Note that placing them at virtual address 0 is essential (i.e. note the 0 in lines such as `.debug_info 0 : { *(.debug_info .gnu.linkonce.wi.*) }`). – amonakov Mar 08 '23 at 21:32
  • @amonakov, I have a custom linker script. I'll paste it above as "edit3". – Lance E.T. Compte Mar 08 '23 at 22:55
  • 1
    @LanceE.T.Compte Compare your linker script with default one as @amonakov adviced and check what `.debug*` sections you don't place into elf but default script does. What if you copy .debug-related stuff from default script into your custom one? – dimich Mar 09 '23 at 00:13
  • @dimich, Indeed that's a good idea. I'll first just leave off my `-T` and see if the lines are not stripped out. I'll also figure out which of the many options gcc prefers. Perhaps I can audit the differences. We use a custom script to get certain pieces of code at certain locations. Perhaps there's a better way for that as well... – Lance E.T. Compte Mar 09 '23 at 00:36
  • 1
    Ah, no, you cannot rename and merge together all different debug sections, their names matter. – amonakov Mar 09 '23 at 06:49
  • Just always set -g as a flag first. – S_IROTH Mar 09 '23 at 18:08
  • 1
    Without your custom linker script, -nostdlib, -nodefaultlibs, and -Wl it works for me. What did you learn when you tried without the linker script? – James Risner Mar 11 '23 at 22:22
  • @JamesRisner and others... When I provide NO linker script, it works. When I manually provide the default linker script obtained with "-Wl,--verbose", it works. When I copy all of the debug sections out of the default linker script into my linker script, it still does not work. We have proven that the problem is something in my linker script, but I haven't had time to debug it further. Sorry, working on higher priority at the moment... :-/ – Lance E.T. Compte Mar 13 '23 at 16:59
  • @LanceE.T.Compte you can’t share the whole linker script? – James Risner Mar 13 '23 at 20:38
  • @JamesRisner, God bless you, but I cannot. It's not actually "mine", and even with sanitizing names, the owners might be upset... :-( – Lance E.T. Compte Mar 13 '23 at 22:26
  • (With all your help...) I HAVE MADE IT WORK! After focusing on the linker script for a bit, cleaning out unused things, changing the order of some symbols/sections, adding some new ones, the C source showed up! I'm going to believe that the problem was the linker script 100%. You all pointed me there. There were clearly sections in the default linker script that were not in mine. I don't know which DWARF section was important, but that was one problem. Since I changed many things, the other thing that was important remains a mystery, and I don't have time to fully understand it. – Lance E.T. Compte Mar 13 '23 at 22:31
  • Since I'm not sure what else to do, I'll give the bonus to "amonakov", "dimich", or "James Risner". Whoever of them posts something as an answer, I'll give the award. Thank you all for your help! – Lance E.T. Compte Mar 13 '23 at 22:37

1 Answers1

1

This worked correctly for me without a linker script, so the issue is in the linker script.

Your custom linker script has an error in its format or a bug that is removing the source.

You can't share the linker script, per employer prohibition. So you should compare the default linker script and your linker script for any missing or changed elements.

James Risner
  • 5,451
  • 11
  • 25
  • 47