0

I am using Vtune Threading mode to profile my project which running on windows 10. At Top-down view, I found 39.1% cpu time spend on spinning, callstack show in below picture.
Top-down view

But in Platform View, I find the spinning callstack only cost 40us per frame, in my project on frame cost about 7~14ms,
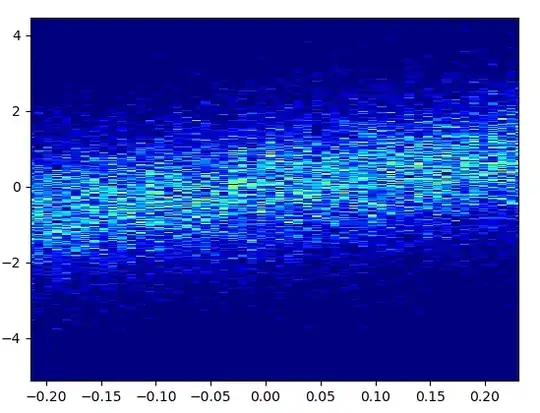
Platform View 1

Platform View 2

1.Whether I need to pay attention to the spin time of WaitForSingleObject, if i want to optimize running speed of my project

2.Why Top-down view show ApexScene::simulate spinning cost 39.1% Cup time ,but ApexScene::simulate callstack only cost 3%~6% cpu time each frame at Platform View

As far as I can see, WaitForSingleObject make thread enter kernel mode, which cost a large amount of cpu time, but thread will not spinning when there is not signal

  • Can you please provide "minimal reproducible" (example: https://stackoverflow.com/help/minimal-reproducible-example) so that we can try reproducing your issue from our end? On which version of Vtune you are trying? – Jaideep - Intel Jan 05 '23 at 11:57
  • I find that Vtune spin time inaccurate. Same environment, same program, when I set CPU sampling interval 10ms, I get 57.5% spin time; but when set CPU sampling interval 1ms, I get 29.1% spin time. If I use Hardware Event-Based mode, there ara 6.6% spin time. – charlesJKing Jan 11 '23 at 11:16
  • To test which mode is accurate, I write one test progam, looping WaitForSingleObject function, and hook WaitForSingleObject calculate execution time,the conclusion is that spin time from Hardware Event-Based mode same as my result – charlesJKing Jan 11 '23 at 11:19

0 Answers0