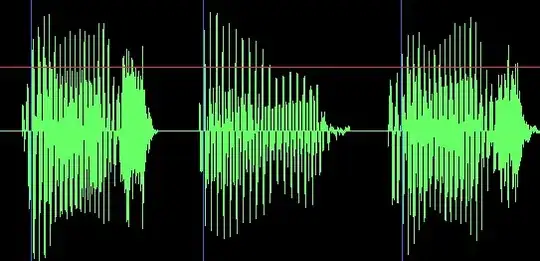
So I want to change the color of the blue vlines(matplotlib) in the above plot.
First I want to make the negative(< 0) values different color and take their absolute so that only amplitude is visible but they will be a different color than the negative ones. Positive values could remain unchanged.
minimum reproducible code as below:
import numpy as np
import random
import matplotlib.pyplot as plt
peakmzs = np.array([random.uniform(506, 2000) for i in range(2080)])
peakmzs = peakmzs[peakmzs.argsort()[::1]]

spec = np.zeros_like(peakmzs)
b = np.where((peakmzs > 1500) & (peakmzs < 1540))[0]
spec[b] = [random.uniform(0, 0.002) for i in range(len(b))]

b = np.where((peakmzs > 700) & (peakmzs < 820))[0]
spec[b] = [random.uniform(0, 0.05) for i in range(len(b))]

spec[300:302] = 0.07

b = np.where((peakmzs > 600) & (peakmzs < 650))[0]
spec[b] = [random.uniform(0, 0.03) for i in range(len(b))]

plt.vlines(peakmzs, spec, ymax=spec.max())
plt.show()


shp_values = np.zeros_like(peakmzs)
b = np.where((peakmzs > 1500) & (peakmzs < 1540))[0]
b_ = np.random.randint(1500, 1540, 10)
# print(b_)
shp_values[b] = [random.uniform(-0.003, 0.002) for i in range(len(b))]
shp_values[b_] = 0

b = np.where((peakmzs > 700) & (peakmzs < 820))[0]
shp_values[b] = [random.uniform(-0.004, 0.002) for i in range(len(b))]
b_ = np.random.randint(700, 820, 70)
shp_values[b_] = 0
# [random.uniform(-0.005, 0.003) for i in range(len(peakmzs))]
plt.plot(shp_values)