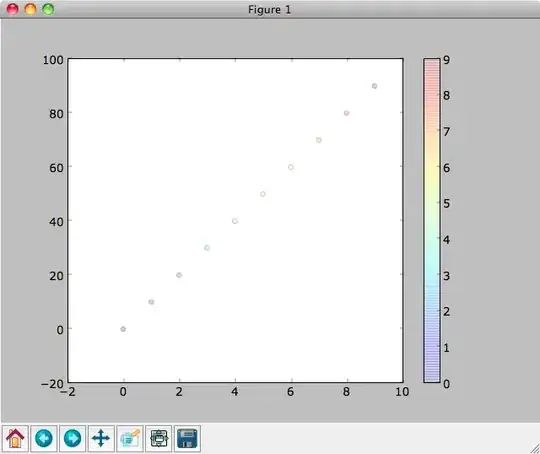
I want to plot a Scatterplot using joint plot where I am using Hue. But the KDE plots on the axes are not desired. Instead of those, I need to plot the histogram containing the aggregate count in the range of specific x and y. How can I do that? 
In the above Image, instead of these kde plots, I need histogram plotted for aggregate number of count of points in that x and y range