I haven't worked with Spectacle Editor before, but I downloaded and installed the latest version (0.1.6) and tried to embed an interactive plot in a presentation slide. I'll go through the steps I took to reproduce your error as well as a possible solution.
You probably already did the following, but I started by selecting Plotly & Dash:

Then I was prompted to provide an Embed Url:

As you noticed, if you place a link to a local dash app (like http://127.0.0.1:8050/) in the Embed Url box, the static image loads, but there is no interactivity when you start a slideshow. It may be a bug with Spectacle Editor or maybe local Dash apps aren't supported.
I don't know your entire use case, but from the code that you've included, it doesn't appear that plotly-dash is necessary because you are placing the figure in the Dash app, but you're not using callbacks or other html components besides html.Div for the figure.
I'd also point out even if you could embed a local dash app in your presentation and preserve the interactivity, it's not a stable solution – you would have to keep the dash app running constantly in order for your figure to show up in your spectacle editor presentation. If the dash app crashes, the figure disappears from the presentation.
If you only need to get an interactive figure into your Spectacle Editor presentation, you can use Chart Studio – I'll go through the steps outlined in this article, as well as in the plotly and Chart Studio documentation here:
- In your terminal (or integrated terminal in VSCode), run the following:
pip install chart_studio
- Create a Chart Studio account here
- Go to the API keys panel, generate an API key, and copy it.
Then at the top of your code after your other imports, you'll import
chart_studio and set your credentials with the following lines (replace {username} and {api_key} with your own):
import chart_studio
chart_studio.tools.set_credentials_file(username={username}, api_key={api_key})
- Add the following import statement, and another line after your
fig is created to upload the fig to chart studio:
import chart_studio.plotly as py

# create figure

py.plot(fig, filename = 'scatter-for-spectacle', auto_open=True)
- Run your
.py file, and it will automatically open the chart studio url where your figure was uploaded
- Copy the url and paste it into the Spectacle Editor
Embed Url box
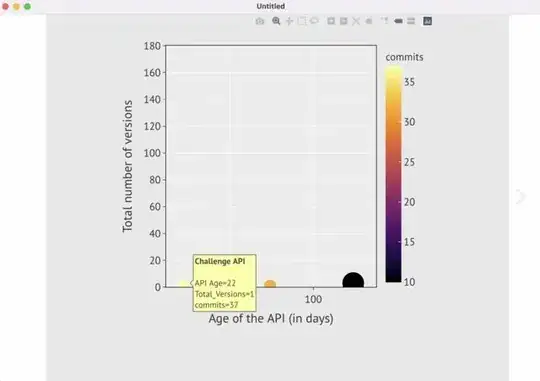
Here is what my Spectacle Editor presentation looks like once I play a slideshow (notice the interactive toggle):
And here is the full code to create a sample figure and upload it to Chart Studio:
import pandas as pd
import plotly.express as px

import chart_studio
chart_studio.tools.set_credentials_file(username={username}, api_key={api_key})
## the config file will be set to public sharing by default

import chart_studio.plotly as py

final_api = pd.DataFrame(
    {'id': {0: 70.0, 1: 77.0,2: 78.0,3: 83.0,4: 84.0,5: 85.0,6: 90.0,7: 96.0,8: 124.0,9: 125.0},
    'commits': {0: 32, 1: 32, 2: 32,3: 32,4: 37,5: 37,6: 10,7: 10,8: 10, 9: 10},
    'info_title': {0: 'SQAaaS API',1: 'SQAaaS API',2: 'SQAaaS API',3: 'SQAaaS API',4: 'Registry of Open Community Challenge API',5: 'Challenge API', 6: 'Onfido API',7: 'Onfido API', 8: 'Onfido API',9: 'Onfido API'},
    'API Age': {0: 74, 1: 74, 2: 74, 3: 74, 4: 22, 5: 22, 6: 124, 7: 124,8: 124, 9: 124},
    'Total_Versions': {0: 1, 1: 1, 2: 1, 3: 1,4: 1,5: 1, 6: 3, 7: 3,8: 3, 9: 3}}
)

fig = px.scatter(final_api, x="API Age", y="Total_Versions", color="commits", hover_name="info_title", height=900, width=1000, size='Total_Versions', size_max=30,color_continuous_scale=px.colors.sequential.Inferno)
fig.update_layout(
    height=600,
    width=600,
    template='ggplot2',
    yaxis_title=" Total number of versions",
    xaxis_title="Age of the API (in days)",
    yaxis_range=[0, 180],
    hoverlabel=dict(font_size=16, font_family="PT Sans"),font=dict(size=20, family='PT Sans'), paper_bgcolor='rgba(233,233,233,100)'
)
fig.update_xaxes(showline=True, linewidth=1, linecolor='black', mirror=True)
fig.update_yaxes(showline=True, linewidth=1, linecolor='black', mirror=True)

py.plot(fig, filename = 'scatter-for-spectacle', auto_open=True)


