I have a dataset where I want to create an animated plot. This plot is going to show progression of the x and y values over time. I can get that working just fine, where this produces a plot with a moving point:
library(dplyr)
library(ggplot2)
library(gganimate)
library(gifski)
library(transformr)

main_data <- data.frame(timestep=as.POSIXct(1L:10L, origin=Sys.time()),
                        x=1L:10L, y=1L:10L)

main_data %>%
  ggplot(data=main_data, mapping=aes(x=x, y=y, group=1)) +
    geom_point() +
    transition_manual(timestep) ->
    plot_1

animate(plot_1, duration=5, fps=2, renderer=gifski_renderer())
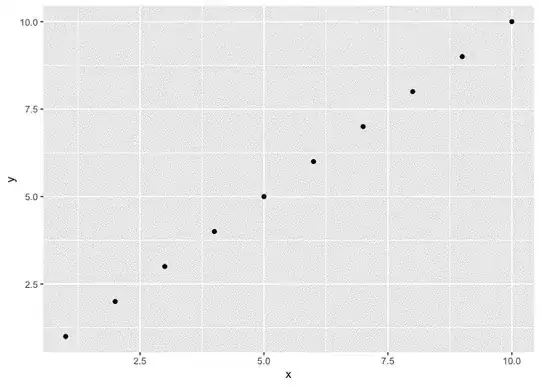
However, what I'd like to add is a geom_path() showing the path of the data in the background and that should be static, so it is present in every frame of the animation and the point moves along it. Is there a way to do this? I have experimented with a few things and thought maybe adding it "after" the transition might work, but no luck.
plot_1 +
  geom_path() ->
  plot_2

animate(plot_2, duration=5, fps=2, renderer=gifski_renderer())
A similar effect is created using the geom_hline() which acts as a static element in the figure:
plot_1 +
  geom_hline(yintercept=4) ->
  plot_3

animate(plot_3, duration=5, fps=2, renderer=gifski_renderer())
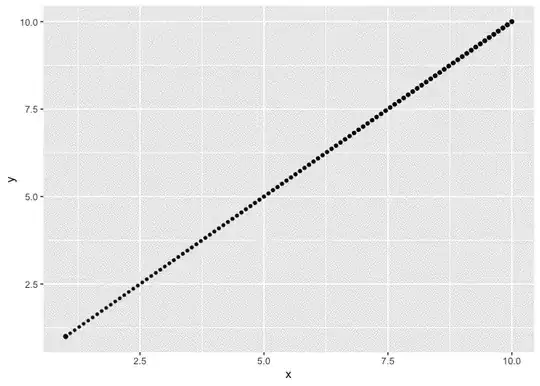
And a similar effect is created by using geom_abline() but the actual data I will use this for will follow a non-linear path so that won't work (but at least it shows what I am trying to achieve).
plot_1 +
  geom_abline() ->
  plot_4

animate(plot_4, duration=5, fps=2, renderer=gifski_renderer())