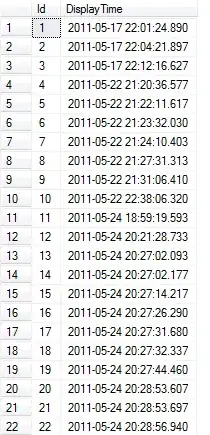
I have a DataFrame like this:
import pandas as pd
import numpy as np

index_columns = [
  ['en'] * 3 + ['fr'] * 3 + ['it'] * 3,
  ['count', 'mean', 'std'] * 3
]

df = pd.DataFrame(np.random.randn(9, 2), index=index_columns)
df
It would be more convenient visually to somehow separate the rows corresponding to different languages. For example, draw a grid line between the botton en row and the top fr row, and another between fr and it. Or, to set a different background color for each language.
What is a good way to achieve such separation?
