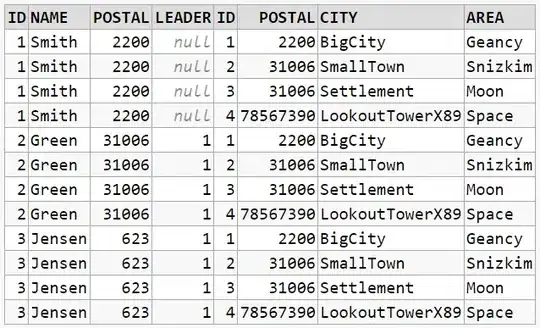
I am a newbie creating an OpenSearch Dashboard. I wonder whether it is possible to customise the axis of the charts that are created. For example, if I was representing information based on countries, would be possible to add images or pictograms about flags? 
Many thanks in advance.