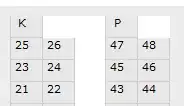
and I need to arrange it by team as rows and year (2010 - 2015) as attributes, so Ive tried with xtabs and table function, but I only get the count, instead of the points that the table contains.
Tried
dcast(EvoTeam, club_name~newdate, value.var = "total")

Although I define value.var as the score I am looking for, I still just get the frequency table. What am I doing wrong here?
