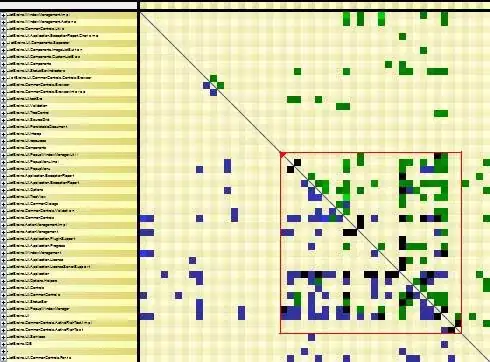
I want to do a plot for my ordered logit model to check if the assumption of parallel regression holds or not. But I really do not now how to code it or where to begin. I wanted to do a similarly to this using R(RStudio) to see if my model is violated or if the assumption holds:


Here is my R codes for the model I'm estimating with data WVS from the effects package:
library(effects)
library(MASS)

wvs.1 <- polr(poverty ~ country + gender + religion + degree + age, data = WVS, method = "logistic", Hess = TRUE)

summary(wvs.1)

Call:
polr(formula = poverty ~ country + gender + religion + degree +
    age, data = WVS, Hess = TRUE, method = "logistic")

Coefficients:
                 Value Std. Error t value
countryNorway -0.32235   0.073766  -4.370
countrySweden -0.60330   0.079494  -7.589
countryUSA     0.61777   0.070665   8.742
gendermale     0.17637   0.052972   3.329
religionyes    0.17973   0.077346   2.324
degreeyes      0.14092   0.066193   2.129
age            0.01114   0.001561   7.139

Intercepts:
                       Value   Std. Error t value
Too Little|About Right  0.7298  0.1041     7.0128
About Right|Too Much    2.5325  0.1103    22.9496

Residual Deviance: 10402.59
AIC: 10420.59