0

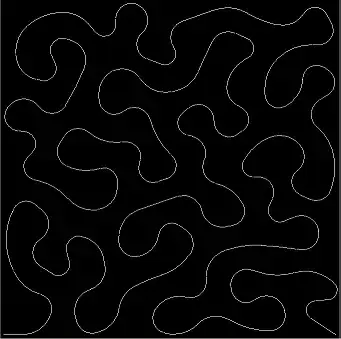
In this figure, the axes are not displayed on the plot. How to fix it? Can anybody help me, thank you!

plot(swedishpines, axes=TRUE)

> dput(swedishpines)
structure(list(window = structure(list(type = "rectangle", xrange = c(0, 
96), yrange = c(0, 100), units = structure(list(singular = "metre", 
    plural = "metres", multiplier = 0.1), class = "unitname")), class = "owin"), 
    n = 71L, x = c(1L, 1L, 2L, 2L, 7L, 9L, 11L, 13L, 14L, 16L, 
    17L, 17L, 20L, 21L, 23L, 24L, 25L, 26L, 27L, 28L, 28L, 33L, 
    33L, 36L, 37L, 39L, 39L, 39L, 41L, 45L, 48L, 49L, 52L, 52L, 
    53L, 53L, 56L, 58L, 59L, 60L, 61L, 61L, 61L, 63L, 65L, 66L, 
    66L, 69L, 72L, 72L, 73L, 74L, 74L, 75L, 76L, 79L, 81L, 82L, 
    83L, 84L, 85L, 86L, 87L, 92L, 92L, 93L, 94L, 94L, 95L, 95L, 
    95L), y = c(99L, 72L, 62L, 84L, 45L, 75L, 85L, 63L, 16L, 
    54L, 26L, 41L, 2L, 80L, 87L, 11L, 70L, 57L, 54L, 42L, 26L, 
    52L, 63L, 59L, 80L, 34L, 47L, 91L, 17L, 23L, 53L, 63L, 43L, 
    75L, 98L, 13L, 78L, 18L, 68L, 55L, 43L, 32L, 25L, 41L, 81L, 
    89L, 16L, 4L, 52L, 60L, 42L, 36L, 54L, 93L, 17L, 85L, 45L, 
    67L, 10L, 32L, 20L, 9L, 87L, 60L, 81L, 8L, 10L, 26L, 23L, 
    46L, 62L), markformat = "none"), class = "ppp")

What if in case of marked point pattern like 'longleaf'?

Puion
  • 3
  • 3

3 Answers3

1

You can use axes = TRUE to get automatic axes which may not be as pretty as you like.

library(spatstat)
plot(longleaf, axes = TRUE)

I would recommend adding the axes afterwards. E.g:

plot(longleaf)
axis(1, pretty(longleaf$x), pos = 0)
axis(4, pretty(longleaf$y), pos = 200)

If you want another legend position use leg.side:

plot(longleaf, leg.side = "right", main = "")
axis(1, pretty(longleaf$x), pos = 0)
axis(2, pretty(longleaf$y), pos = 0)

Ege Rubak
  • 4,347
  • 1
  • 10
  • 18
0

Maybe by explicitly extracting the coordinates from the data?

library(spatstat)

plot(swedishpines$x, swedishpines$y, axes=TRUE)

With regard to OP's comment: "What if in case of marked point pattern like 'longleaf'? ". Do you mean something like this?

plot(longleaf$x, longleaf$y, 
     xlab = "x", ylab = "y", cex = longleaf$marks/50,
     main = "Longleaf pine diameters")
legend("topright",
       title = "Diameter [cm]",
       legend = seq(0, 80, by = 20),
       pch = 1,
       pt.cex = seq(0, 80, by = 20/50))

OP's new requirement for coloured point sizes:
One option may be to plot this within the default plotting function from the spatstat package, which I am not familiar with. The spatstat package seems to force the legend within the plotting area.

mk <- 
  longleaf$marks 

plot(longleaf, cols=function(mk) dplyr::case_when(mk <= 20~"red", mk>20 & mk<=40~"blue", mk>60~"brown"), 
      axes=TRUE, leg.side=c("right"),
      ann = TRUE,
      xlab = "x", ylab = "y",
      border = FALSE, 
      leg.args = list(cols = c("red", "blue", "brown"),
                      sep = 50))

And combining spatstat::plot.ppp with base R legend you could try:

plot.ppp(longleaf, cols=function(mk) dplyr::case_when(mk <= 20~"red", mk>20 & mk<=40~"blue", mk>60~"brown"), 
      axes=TRUE, leg.side=c("right"),
      ann = TRUE,
      xlab = "x", ylab = "y",
      xlim = c(0, 200),
      border = FALSE,
      legend = FALSE)
legend("topright",
       bty = "o",
       legend = seq(20, 60, 20),
       col = c("red", "blue", "brown"),
       pt.cex = (seq(20, 60, 20) / 20),
       pch = 1,
       title = "Diameter",
       y.intersp = 1.5)

Created on 2022-10-23 with reprex v2.0.2

Peter
  • 11,500
  • 5
  • 21
  • 31
  • What if in case of marked point pattern like 'longleaf'? > plot(longleaf, axes=TRUE) – Puion Oct 23 '22 at 10:53
  • I'm not entirely sure what you mean but have assumed you want to include a third dimension: tree diameter. – Peter Oct 23 '22 at 12:10
  • Thank you for your helpful responses, but I think your answer is based on plot.window and 'longleaf$x &longleaf$y' doesn't work for plot.ppp function of the above example. My code is like this; library(spatstat) longleaf mk<-longleaf$marks plot (longleaf, cols=function(mk) case_when (mk <= 20~"red", mk>20 & mk<=40~"blue", mk>60~"black"), axes=TRUE, leg.side=c("right")) In this case, the plot are displayed in different colors and sizes according to marks, but the axes are the same as I asked above, in this case how to fix the problem? – Puion Oct 23 '22 at 13:53
  • I'm not sure if the above edit answers your question. But I do think the question has begun to drift significantly from the original question. And maybe you should think about posting a new question. – Peter Oct 23 '22 at 14:24
0

In your example code, the object swedishpines belongs to the class ppp. When you type plot(swedishpines), the method plot.ppp is invoked. To find out how to control this plot, see the help for the method plot.ppp.

The help file for plot.ppp includes a section explaining how to draw axes. It also answers other common questions, like how to control the white space around the plot.

Some people have suggested that you just extract the x, y coordinates from the object swedishpines and plot them in a scatterplot. This is not advisable, because that would change the relative scale (aspect ratio) of the x and y axes, so that the plot would be spatially distorted. Also plot.default artificially inserts a small space between the data points and the axis, by default, to make the plot easier to read; but this space does not exist in the original physical data.

Adrian Baddeley
  • 2,534
  • 1
  • 5
  • 8