I have a ggplot2 line plot with an odd number of facets. I'd like to add a boxplot of the marginal distribution of the x values in the empty space. The boxplot should be horizontal and share a common x axis with the other facets. Because the default boxplot geom is vertical, coord_flip() is required. Because of this, I don't believe it is possible to include the boxplot data in the same df as the other facets using a dummy factor variable for faceting.
Using grid, I can identify the empty viewport and insert the boxplot, but I want to have the x axes line up. Answers to similar questions (see here or here) suggest using align_plots in the ggExtra package, but I don't believe that will work with the faceting. I've included a simple reproducible example below. If I get this working, I would also have to edit the empty panel Grob to create a new label matching the other facets. Any suggestions would be appreciated.
library(ggplot2)
#generate df for faceted line graphs
df <- data.frame(x = rep(1:100, times=7),
        facet_var = as.factor(rep( 1:7, each=100)),
        y = runif(7*100)
      )
#create faceted line graphs
p <- ggplot(data = df, aes(x, y)) +
    geom_line() + facet_wrap( ~ facet_var, ncol=2)

#generate df for boxplot
xdata <- runif(1000, min = 0, max = 100)
boxdf <- data.frame(x=xdata, group=rep(1,length(xdata)))

#create boxplot removing axes and margins
q <- ggplot(data = boxdf, aes(as.factor(group),x)) + geom_boxplot() +
       coord_flip() + labs(x=NULL) +
       opts(axis.text.x = theme_blank(), axis.title.x=theme_blank(),
         axis.text.y = theme_blank(), axis.title.y=theme_blank(),
         axis.ticks = theme_segment(colour = "white"),
         panel.margin = 0, plot.margin = unit(rep(0,4), "lines")
       )

print(p)
downViewport("panel-14-5")
print(q, newpage=F)
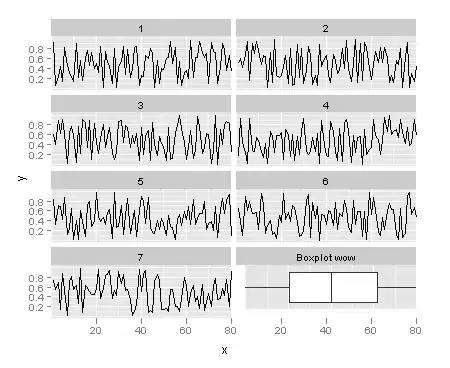
Edit: After kohske's helpful answer, I tried to adapt the code for different x limits and breaks. Here is the code with just the x limits and breaks altered for a range of (0,80). Possibly I am missing something in the code that needs to be altered with the limits.
library(ggplot2)
df <- data.frame(x = rep(1:80, times=7),
        facet_var = as.factor(rep( 1:7, each=80)),
        y = runif(7*80)
      )

# label for marginal plot
df <- rbind(df, data.frame(x = NA, y = NA, facet_var = "Boxplot wow"))

p <- ggplot(data = df, aes(x, y)) +
    geom_line() + facet_wrap( ~ facet_var, ncol=2) +
    # set limits for adjustment
    coord_cartesian(xlim = c(0, 80)) +
    #scale_x_continuous(breaks = 1:4*20)
    opts()

xdata <- runif(1000, min = 0, max = 80)
boxdf <- data.frame(x=xdata, group=rep(1,length(xdata)))

q <- ggplot(data = boxdf, aes(as.factor(group),x)) + geom_boxplot() +

    # set breaks and limits for adjustment
    coord_flip(ylim = c(0, 80)) + labs(x=NULL) +
    scale_y_continuous(breaks = 1:4*20) +

    # opts for full region drawing:
    # see https://kohske.wordpress.com/2010/12/25/drawing-on-full-region-in-ggplot2/
    opts(
    legend.position = "none",
    panel.margin = unit(0,"null"),
    plot.margin = rep(unit(0,"null"),4),
    axis.ticks = theme_blank(),
    axis.text.x = theme_blank(),
    axis.text.y = theme_blank(),
    axis.title.x = theme_blank(),
    axis.title.y = theme_blank(),
    axis.ticks.length = unit(0,"null"),
    axis.ticks.margin = unit(0,"null")
  )

print(p)

# remove unused panel
grid.remove("panel-14-5")

downViewport("panel-14-5")
print(q, newpage=F)