I'm currently setting up Jaeger SPM (service performance metrics) on my application. Below is the code and setup that I'm using, currently failing with Failed to export traces, error code: StatusCode.UNIMPLEMENTED.
What am I missing in my configuration?
otel-collector-config.yml
receivers:
  jaeger:
    protocols:
      grpc:

  otlp:
    protocols:
      grpc:

  prometheus:
    config:

exporters:
  logging:
    loglevel: debug

  prometheus:
    endpoint: '0.0.0.0:8889'
    resource_to_telemetry_conversion:
      enabled: true

  jaeger:
    endpoint: 'jaeger:14250'
    tls:
      insecure: true

  otlp:
    endpoint: otel_collector:4317
    tls:
      insecure: true

processors:
  # https://github.com/open-telemetry/opentelemetry-collector/blob/main/processor/batchprocessor/README.md
  batch:
  # https://github.com/open-telemetry/opentelemetry-collector/blob/main/processor/memorylimiterprocessor/README.md
  memory_limiter:
    check_interval: 5s
    limit_mib: 819
    spike_limit_mib: 256
  spanmetrics:
    metrics_exporter: prometheus
    # latency_histogram_buckets: [100us, 1ms, 2ms, 6ms, 10ms, 100ms, 250ms]
    dimensions_cache_size: 1500
    # The aggregation temporality of the generated metrics.
    # Default: "AGGREGATION_TEMPORALITY_CUMULATIVE"
    aggregation_temporality: 'AGGREGATION_TEMPORALITY_CUMULATIVE'

    # Additional list of dimensions on top of:
    # - service.name
    # - operation
    # - span.kind
    # - status.code
    dimensions:
      # If the span is missing http.method, the processor will insert
      # the http.method dimension with value 'GET'.
      # For example, in the following scenario, http.method is not present in a span and so will be added as a dimension to the metric with value "GET":
      # - calls_total{http_method="GET",operation="/Address",service_name="shippingservice",span_kind="SPAN_KIND_SERVER",status_code="STATUS_CODE_UNSET"} 1
      - name: http.method
        default: GET

      # If a default is not provided, the http.status_code dimension will be omitted
      # if the span does not contain http.status_code.
      # For example, consider a scenario with two spans, one span having http.status_code=200 and another missing http.status_code. Two metrics would result with this configuration, one with the http_status_code omitted and the other included:
      # - calls_total{http_status_code="200",operation="/Address",service_name="shippingservice",span_kind="SPAN_KIND_SERVER",status_code="STATUS_CODE_UNSET"} 1
      # - calls_total{operation="/Address",service_name="shippingservice",span_kind="SPAN_KIND_SERVER",status_code="STATUS_CODE_UNSET"} 1
      - name: http.status_code
        default: 200

extensions:
  health_check:
  memory_ballast:
  pprof:
    endpoint: :1888
  zpages:
    # http://localhost:55679/debug/tracez
    endpoint: :55679

service:
  extensions: [memory_ballast, health_check, zpages, pprof]
  telemetry:
    metrics:
      address: :8888
    logs:
      level: debug
  pipelines:
    traces:
      receivers: [otlp]
      # receivers: [jaeger] # This is creating a problem
      processors: [memory_limiter, spanmetrics, batch]
      exporters: [logging, otlp]
    metrics:
      receivers: [otlp]
      processors: [memory_limiter, batch]
      exporters: [prometheus]
    logs:
      receivers: [otlp]
      processors: [memory_limiter, batch]
      exporters: [logging]
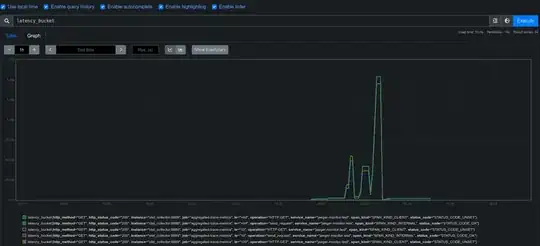
with this, I'm able to see latency bucket and call_total on Prometheus, however, I cannot see the graphs on Jaeger
main.py (simple example)
import time

import httpx
from opentelemetry import metrics, trace
from opentelemetry.exporter.otlp.proto.grpc.metric_exporter import (
    OTLPMetricExporter,
)
from opentelemetry.exporter.otlp.proto.grpc.trace_exporter import (
    OTLPSpanExporter,
)
from opentelemetry.instrumentation.httpx import HTTPXClientInstrumentor
from opentelemetry.sdk.metrics import MeterProvider
from opentelemetry.sdk.metrics.export import PeriodicExportingMetricReader
from opentelemetry.sdk.resources import SERVICE_NAME, Resource
from opentelemetry.sdk.trace import TracerProvider
from opentelemetry.sdk.trace.export import BatchSpanProcessor
from opentelemetry.trace.status import Status, StatusCode


# Service name is required for most backends
resource = Resource(attributes={SERVICE_NAME: "jaeger-monitor-test"})

reader = PeriodicExportingMetricReader(
    OTLPMetricExporter(endpoint="localhost:4317", insecure=True)
    # OTLPMetricExporter(insecure=True)

)
provider = MeterProvider(resource=resource, metric_readers=[reader])
metrics.set_meter_provider(provider)


# Service name is required for most backends
resource = Resource(attributes={SERVICE_NAME: "jaeger-monitor-test"})

provider = TracerProvider(resource=resource)
processor = BatchSpanProcessor(OTLPSpanExporter(endpoint="localhost:14250", insecure=True))
processor = BatchSpanProcessor(OTLPSpanExporter(insecure=True))
provider.add_span_processor(processor)
trace.set_tracer_provider(provider)

meter = metrics.get_meter(__name__)
tracer = trace.get_tracer(__name__)
HTTPXClientInstrumentor().instrument()


def send_request() -> None:
    with tracer.start_as_current_span('send_request') as span:
        with httpx.Client() as client:
            request = client.get("https://www.google.com")
            print(request.status_code)
            time.sleep(2)
            span.set_status(Status(StatusCode.OK)) # Hardcoded


if __name__ == "__main__":
    while True:
        send_request()
Right now if I use otlpas the reciever it works, but without any graphs on SPM.
If I change it to recievers: [jaeger]
it fails with
Failed to export traces, error code: StatusCode.UNIMPLEMENTED