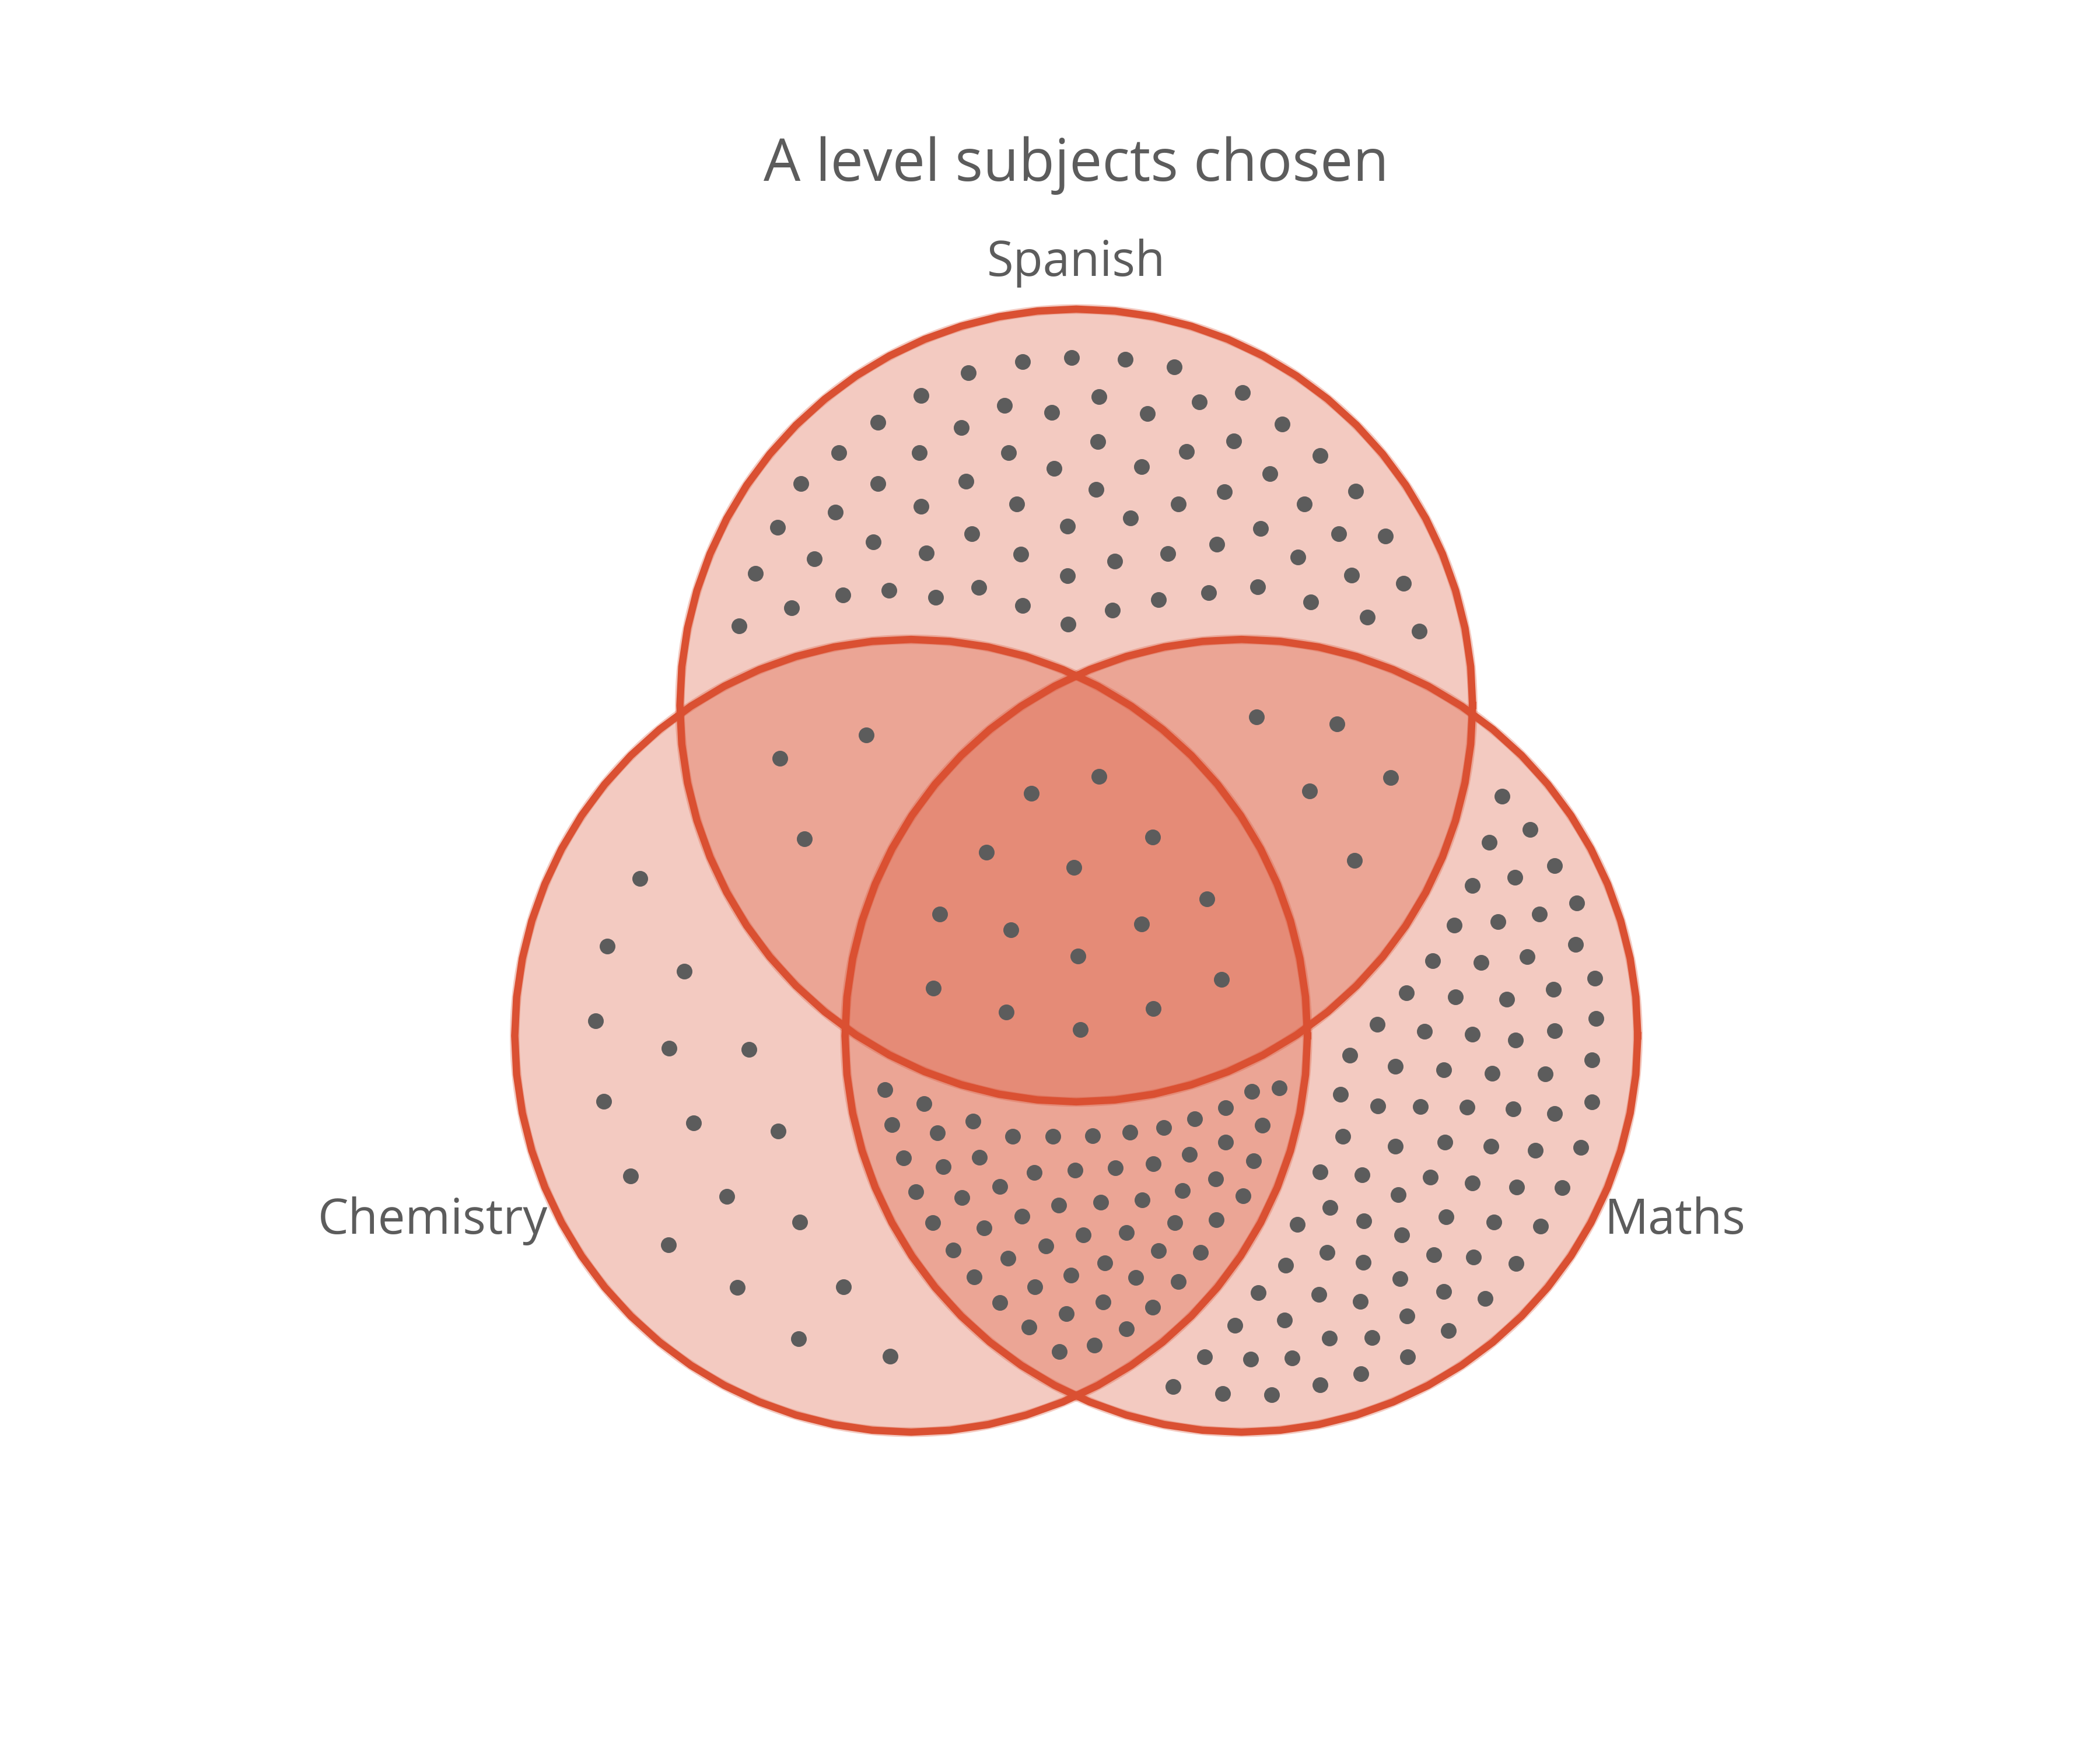
complex-upset offers utilities to create dot density diagrams in R (following the ggplot2 approach, see documentation).

Let's load and filter some data for an example:
library(ggplot2)
library(ComplexUpset)
movies = as.data.frame(ggplot2movies::movies)
genres = c('Comedy', 'Drama', 'Action')
movies[genres] = movies[genres] == 1
movies[movies$mpaa == '', 'mpaa'] = NA
movies = na.omit(movies)
First, you need to arrange the data
movies_subset = head(movies, 300)

movies_subset$good_rating = movies_subset$rating > mean(movies_subset$rating)
arranged = arrange_venn(movies_subset, sets=genres)
Then, you can plot it with standard ggplot2 functions and new geoms provided by complex-upset: geom_venn_region, geom_venn_circle, geom_venn_label_set:
(
    ggplot(arranged)
    + theme_void()
    + coord_fixed()
    + geom_venn_region(movies_subset, sets=genres_subset, alpha=0.2)
    + geom_point(aes(x=x, y=y, color=region), size=1.5)
    + geom_venn_circle(movies_subset, sets=genres_subset, size=2)
    + geom_venn_label_set(movies_subset, sets=genres_subset, aes(label=region), outwards_adjust=2.6)
    + scale_color_venn_mix(movies, sets=genres_subset, guide='none')
    + scale_fill_venn_mix(
          movies, sets=genres_subset,
          guide='none',
          highlight=c('Comedy-Action', 'Drama'),
          inactive_color='white'
      )
)
It can also annotate individual points (and more!)
But this implementation has a few limitations:
- it only supports up to three sets
- it is slow to arrange with large datasets (>1000 observations)
- often fine-tuning the arrangement parameters is required to get a desired result
- as of the day of writing there are some minor improvements available in latest version which can be installed from GitHub but not from CRAN (yet)
Disclaimer: I am the author of ComplexUpset.

