Given
import matplotlib.pyplot as plt
import random

fig, ax = plt.subplots(1, 2, figsize = [9, 5], dpi = 100)
xs = [random.randint(-10, 10) for _ in range(10)]
ys = [random.randint(-10, 10) for _ in range(10)]

xx = [random.randint(-20, 20) for _ in range(10)]
yy = [random.randint(-20, 20) for _ in range(10)]

ax[0].plot(xs, ys)
ax[1].plot(xx, yy)

plt.show()
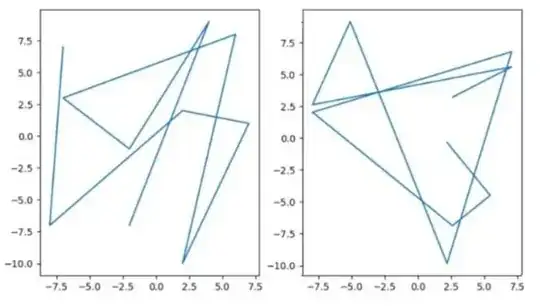
which produces
I want the xticks and yticks of the second plot to be the same as that of the first plot without affecting the plot's data that is displayed. So basically I want to just transform / mask the ticks to match that of the first plot and keep every thing else intact.
Here is an example of what I am trying to achieve. Notice the ticks

I have tried
ax[1].xaxis.set_major_formatter(ax[0].xaxis.get_major_formatter())ax[1].set_xticks(ax[0].get_xticks())ax[1].set_xticklabels(ax[0].get_xticklabels())- Some other ticks.Formatter stuff that transforms each element individually but that seems like overkill
none of these do what I want to achieve.
Edit for clarification
People don't seem to understand what I am asking for. I do not want the plot to be affected (zoomed-in, zoomed-out, translated, rotated) when changing the tick labels. So given ax[1] and ax[2] the exact same plot, something like
xmin,xmax = ax[0].get_xlim()
ymin,ymax = ax[0].get_ylim()
ax[2].set_xlim(xmin,xmax)
ax[2].set_ylim(ymin,ymax)
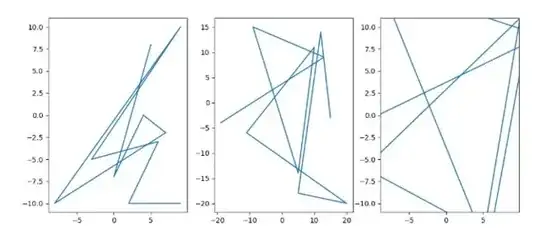
produces
notice how the third plot (with changed tick labels) is zommed-in compared to the second, which is not what I want. I want the second plot and third plot to remain the same but to have different ticks (to match that of the first plot)


