0

I am trying to plot the result of Tsne using gscatter in Matlab. I want to use specific color for training and other color for Anchors

Y=tsne(xtrain; xAnxhors]);
gscatter(Y(:,1),Y(:,2));

That is the code that I used but I got the figure in one color only so I want to show the diffrence of colors between xtrain and xAnchors
1 Answers1

0

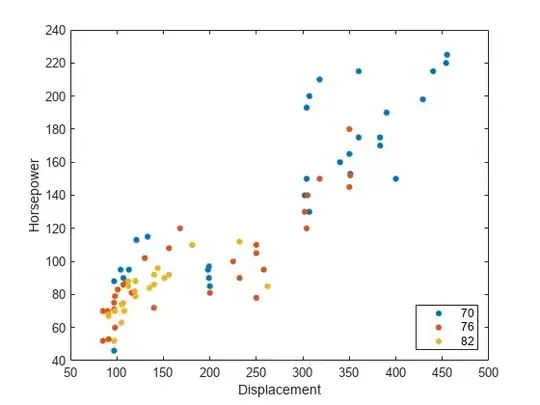
The function gscatter allows you to specify two more arguments. With the first one you can already define groups (a vector that indicates for each point what group it belongs to) which will automatically assign different colours to different groups. The second argument allows for an even more fine grained control about the actual choice of colours. For reference an example from the documentation:

Plot the Displacement values on the x-axis and the Horsepower values on the y-axis. gscatter uses the variable names as the default labels for the axes. Group the data points by Model_Year.

load carsmall
gscatter(Displacement,Horsepower,Model_Year)
flawr
  • 10,814
  • 3
  • 41
  • 71