Based on one cell with dates (some of them repeats multiple times):
- 06.02.2022
- 06.02.2022
- 08.02.2022
- 10.02.2022
- 17.02.2022
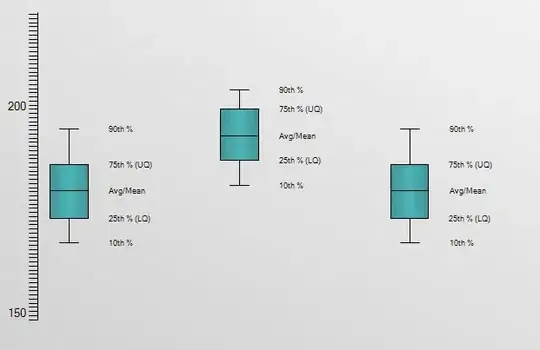
How to create the Google Sheets chart, where line goes up only when calendar day is exist in cell (and goes up multiply, based on x times when date repeats in cell)?
As a result:


