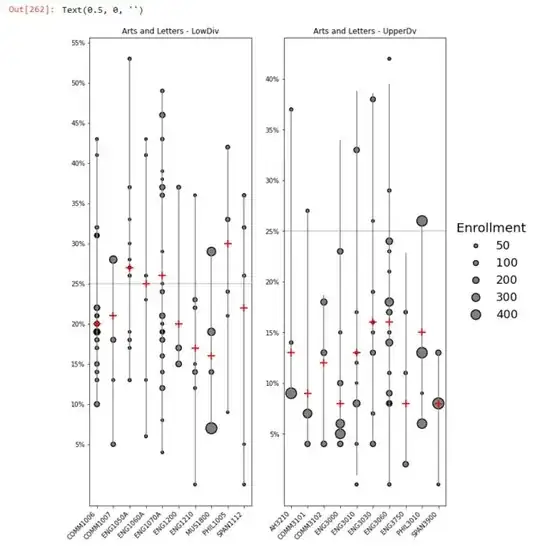
I have two scatter-plot graphs ax1 and ax2 where I made them into subplots using fig, (ax1, ax2) = plt.subplots(1,2, figsize=(10,15))
I am trying to recreate a similar output as shown here: Output Wanted
I set the y-axis tick values for both graphs using ax1.yaxis.set_ticks(np.arange(5, 60, 5)) and ax2.yaxis.set_ticks(np.arange(5, 60, 5)) , However the y-axis tick values for the second graph doesn't match the y-axis tick values in the first graph, even though I set the same tick values for both ax1 and ax2 . Also ignore the vertical lines as that is a different problem that I am facing.
My current output is this graph below:
My full code implementation here, Thank you for any help:
import matplotlib.ticker as mtick

fig, (ax1, ax2) = plt.subplots(1,2, figsize=(10,15))

sns.scatterplot(data=TempFilter_df, x="D_CRS_LAB", y="DFWI_PCT", size="ENR", legend=False, sizes=(15, 300),
                     color='grey', edgecolor='black', linewidth=1.5, ax=ax1)


#plt.yticks(np.arange(5,60, 5))
ax1.yaxis.set_ticks(np.arange(5, 60, 5))


y_value=['{:,.0f}'.format(x) + '%' for x in ax1.get_yticks()]
ax1.yaxis.set_major_formatter(mtick.PercentFormatter())
# ax1.yaxis.set_ticks(y_value)
# ax1.set_yticklabels(y_value)

#To plot vertical lines
ax1.axvline(x=0, ymin=0.22, ymax=0.78, color='grey')
ax1.axvline(x=1, ymin=0.13, ymax=0.53, color='grey')
ax1.axvline(x=2, ymin=0.27, ymax=0.954, color='grey')
ax1.axvline(x=3, ymin=0.15, ymax=0.78, color='grey')
ax1.axvline(x=4, ymin=0.114, ymax=0.885, color='grey')
ax1.axvline(x=5, ymin=0.30, ymax=0.68, color='grey')
ax1.axvline(x=6, ymin=0.045, ymax=0.66, color='grey')
ax1.axvline(x=7, ymin=0.17, ymax=0.54, color='grey')
ax1.axvline(x=8, ymin=0.2, ymax=0.767, color='grey')
ax1.axvline(x=9, ymin=0.046, ymax=0.66, color='grey')

ax1.axhline(y=25, xmin=0, xmax=1, color='grey', alpha=0.47)

#plt.xticks(rotation = 45)
fig.autofmt_xdate(rotation=45)


ax1.set_ylabel('') #Works
ax1.set_xlabel('')


ax1.set(title='Arts and Letters - LowDiv')

ax_OvrAll = sns.scatterplot(data=FilterOveAll, x="Class_Labels", y="OVERALL_RATE", legend=False,
                     color='red', linewidth=2.0, marker='+', s=150, ax=ax1, zorder=2)

ax_OvrAll.get_xaxis().set_visible(True)
ax_OvrAll.get_yaxis().set_visible(True)

#----------------------------------------------------------------------------------
#----------------------------------------------------------------------------------
ax2.yaxis.set_ticks(np.arange(5, 60, 5))

sns.scatterplot(data=TempFilter_df_2, x="D_CRS_LAB", y="DFWI_PCT", size="ENR", legend=True, sizes=(15, 300),
                     color='grey', edgecolor='black', linewidth=1.5, ax=ax2)


#plt.yticks(np.arange(5,60, 5))
y_value=['{:,.0f}'.format(x) + '%' for x in ax2.get_yticks()]
ax2.set_yticklabels(y_value)


#To plot vertical lines
plt.axvline(x=0, ymin=0.25, ymax=0.845, color='grey')
plt.axvline(x=1, ymin=0.13, ymax=0.63, color='grey')
plt.axvline(x=2, ymin=0.13, ymax=0.45, color='grey')
plt.axvline(x=3, ymin=0.15, ymax=0.78, color='grey')
plt.axvline(x=4, ymin=0.065, ymax=0.885, color='grey')
plt.axvline(x=5, ymin=0.13, ymax=0.88, color='grey')
plt.axvline(x=6, ymin=0.045, ymax=0.90, color='grey')
plt.axvline(x=7, ymin=0.09, ymax=0.54, color='grey')
plt.axvline(x=8, ymin=0.18, ymax=0.6, color='grey')
plt.axvline(x=9, ymin=0.046, ymax=0.33, color='grey')

plt.axhline(y=25, xmin=0, xmax=1, color='grey', alpha=0.47)


plt.ylabel('', size=18)
ax1.set_ylabel('') #Works
ax1.set_xlabel('')

plt.xlabel('', size=18)


# For Legend
line = Line2D([], [], label='50', color='black', linewidth= 0.0, marker='o',
              markerfacecolor='grey', markeredgewidth=1.5, markersize=6)

line2 = Line2D([], [], label='100', color='black', linewidth= 0.0, marker='o',
              markerfacecolor='grey', markeredgewidth=1.5, markersize=8)

line3 = Line2D([], [], label='200', color='black', linewidth= 0.0, marker='o',
              markerfacecolor='grey', markeredgewidth=1.5, markersize=10)

line4 = Line2D([], [], label='300', color='black', linewidth= 0.0, marker='o',
              markerfacecolor='grey', markeredgewidth=1.5, markersize=12.5)

line5 = Line2D([], [], label='400', color='black', linewidth= 0.0, marker='o',
              markerfacecolor='grey', markeredgewidth=1.5, markersize=15)
plt.legend(handles=[line, line2, line3, line4, line5], title='Enrollment', title_fontsize=20,
           frameon=False, loc='center left', bbox_to_anchor=(1, 0.5), prop={'size': 18}, scatterpoints=1)


ax2.set(title='Arts and Letters - UpperDv')


ax_OvrAll = sns.scatterplot(data=FilterOveAll_2, x="Class_Labels", y="OVERALL_RATE", legend=False,
                     color='red', linewidth=2.0, marker='+', s=150, ax=ax2, zorder=2) #everything in here goes into ax2

ax_OvrAll.get_xaxis().set_visible(True)
ax_OvrAll.get_yaxis().set_visible(True)

#to hide x and y labels
ax2.set_ylabel('')
ax2.set_xlabel('')
