0

I woudl like to create a Azure Dashboard template to monitor CPU percentage for my App Service Plan. Currently It look like this:

resource dashboardName_resource 'Microsoft.Portal/dashboards@2020-09-01-preview' = {
  name: dashboardName
  location: location
  properties: {
    lenses: [
      {
        order: 0
        parts: [
          {
            position: {
              x: 0
              y: 4
              rowSpan: 3
              colSpan: 11
            }
            metadata: {
              inputs: [
                {
                  name: 'queryInputs'
                  value: {
                    timespan: {
                      duration: 'PT1H'
                    }
                    id: resourceId(appServicePlanResourceGroup, 'Microsoft.Web/serverfarms', appServicePlanName)
                    chartType: 0
                    metrics: [
                      {
                        name: 'CPU Percentage'
                        resourceId: resourceId(appServicePlanResourceGroup, 'Microsoft.Web/serverfarms', appServicePlanName)
                      }
                    ]
                  }
                }
              ]
              type: 'Extension/Microsoft_Azure_Monitoring/PartType/MetricsChartPart'
            }
          }

        ]
      }
    ]
  }
}

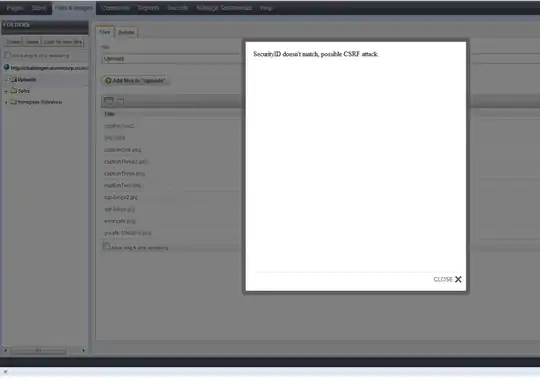
The validation & deployment was succesfull, but when I get to this dashboard i got this:enter image description here Does anyon knows why?

Jahnavi
  • 3,076
  • 1
  • 3
  • 10
user346206
  • 165
  • 10

1 Answers1

0

By referring a document from MS sample replica of your bicep code is created and was able to deploy it successfully.

While I am doing a repro, I have changed type extension in .bicep file fromtype:'Extension/Microsoft_Azure_Monitoring/PartType/MetricsChartPart to type:'Extension/HubsExtension/PartType/MonitorChartPart' which got succeeded and able to view the CPU metrics.

Attaching a sample code for your reference:

param  location  string = resourceGroup().location
param  appServicePlanResourceGroup  string = 'xxxxx'
param  appServicePlanName  string = 'xxxxxxx'

resource  symbolicname  'Microsoft.Portal/dashboards@2020-09-01-preview' = {
  name: 'xxxxmydemo'
  location: location
  tags: {
    demo: 'repro01'
 }

  properties: {
    lenses: [
      {
        metadata: {}
        order: 2
        parts: [
          {
            metadata: {
              type: 'Extension/HubsExtension/PartType/MonitorChartPart'
              inputs: [
                {
                   name: 'queryInputs'
                   value: {
                     timespan: {
                       duration: 'PT1H'
                      }
                      id: resourceId(appServicePlanResourceGroup, 'Microsoft.Web/serverfarms', appServicePlanName)
                      chartType: 0
                      metrics: [
                        {
                          name: 'CPU Percentage'
                          resourceId: resourceId(appServicePlanResourceGroup, 'Microsoft.Web/serverfarms', appServicePlanName)
                      }
                    ]
                  }
                }
              ]
            }
            position: {
              colSpan: 11
              metadata: {}
              rowSpan: 5
              x: 3
              y: 4
            }
           }
         ]
        }
      ]
       metadata: {}
    }
  }
  

Output for your reference: enter image description here

Note: Validate access control(IAM) permissions for the resource group ideally and it should be part of it.

Jahnavi
  • 3,076
  • 1
  • 3
  • 10