I have an XYZ dataset containing 36,000 points in which I'd like to interpolate via the method of kriging
I needed an open source way in Python to do Kriging interpolation, so decided to try PyKrige. I tried the below script
import numpy as np
import matplotlib.pyplot as plt
import pykrige.kriging_tools as kt
from pykrige.ok import OrdinaryKriging
from pylab import *
import pandas as pd

np.set_printoptions(suppress=True)

data = np.loadtxt("c:/test.xyz", dtype='float')
print(data)


OK = OrdinaryKriging(
    data[:, 0],
    data[:, 1],
    data[:, 2],
    variogram_model='spherical',
    verbose=True,
    enable_plotting=False,
    nlags=5,
)

OK.variogram_model_parameters

gridx = np.arange(626000, 629100, 50, dtype='float')
gridy = np.arange(231500, 234500, 50, dtype='float')
zstar, ss = OK.execute("grid", gridx, gridy)

print(zstar.shape)
print(ss.shape)

cax = plt.imshow(zstar, extent=(626000, 629100, 231500, 234500), origin='lower')
kt.write_asc_grid(gridx, gridy, zstar, filename="C:/users/public/output2.asc")
print('image saved')
Whilst it works, the results are horrific:

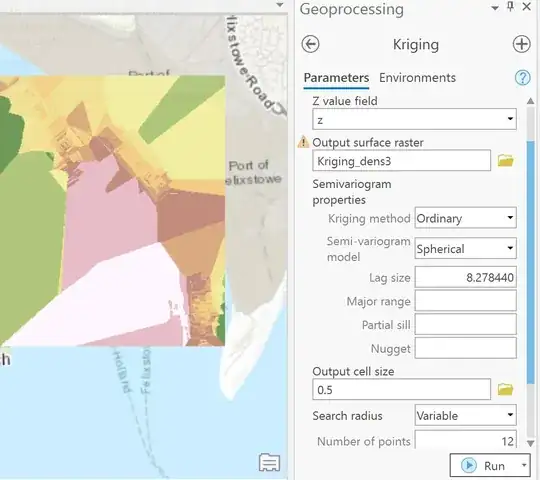
Whereas, Kriging Interpolation in ArcGIS Pro on the exact same dataset gives these results:

Can anyone advise on how to refine my script to replicate more Arc's Kriging results??