0

When plotting data using plotly.graph_object sunburst some labels are missing when compared to same data plotted with plotly.express sunburst

Plot missing the outermost sections:

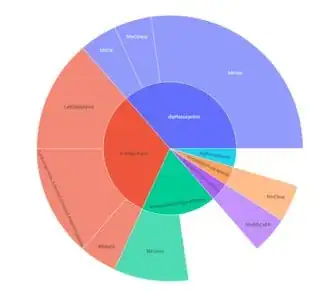
Data is still there because when expanded it the data moves from other parents to their intended place

Graph showing the motion of the data:

you can see "btnCancel" moving over from "dlgMessageBox" to "frmRibbonConfigureOffsets"

Here is same data plotted with express:

Code used:

    # results is a pandas dataframe after some formatting and data analysis
    # extract needed data to form a list data
    p = results["Parent Name"] .to_list()
    n = results["Control Name"].to_list()
    c = results["Count"]       .to_list()
    # parents requiere "" parents with 0 val, but can't have duplicates
    pRed = results["Parent Name"].drop_duplicates().to_list()
    
    # make plot grid and set plot types acordingly
    fig = subplots.make_subplots(rows=1, cols=2, specs=[[{"type": "pie"}, {"type": "pie"}]])
    fig.add_sunburst(
        parents = ["" for _ in pRed] + p,   # parent list, parents of parents are ""
        labels  =              pRed  + n,   # data lable list
        values  = [ 0 for _ in pRed] + c,    # values, parents have 0
        row=1, col=1
    )
    # this second plot is to be replaced by a different type of plot later
    fig.add_sunburst(
        parents = ["" for _ in pRed] + p,   # parent list, parents of parents are ""
        labels  =              pRed  + n,   # data lable list
        values  = [ 0 for _ in pRed] + c,    # values, parents have 0
        row=1, col=2
    )
    # show plots
    fig.show()
    # express plot for comparasin
    expressPlot = px.sunburst(
        results,
        path=[ "Parent Name", "Control Name" ],
        values="Count"
    )
    expressPlot.show()

Any other formatting of the data passed to the labels/parents results in empty plots

Derek O
  • 16,770
  • 4
  • 24
  • 43
mattK.PH
  • 1
  • 1

1 Answers1

0

I managed to reproduce your issue despite the missing DataFrame in your question. The main problem is you have two children named btnCancel:

  • One with dlgMessageBox parent
  • One with frmRibbonConfigureOffsets parent

If you look closely at the plot generated by Plotly express, you have ids corresponding to your children with the following format: parent_name/child_name. This is a secure way to avoid issues as each ID is unique.

If you want to make subplots instead of using plotly.express, you need to add ids in your plot. Here is the full reproducible code below.

import pandas as pd
from plotly import subplots
import plotly.express as px

# Data used in the example
results = pd.DataFrame({"Parent Name": ["dlgMessageBox"]*3 + ["frmMainForm"]*3 + ["frmRibbonConfigureOffsets"]*2,
                        "Control Name":["btnOK", 'btnCancel', 'btnYes'] + ['LeftSlidePanel', 'Something', 'Ribbon1'] 
                        + ['btnCancel', 'btnSave'],
                        "Count": [1, 1, 7, 3, 3, 1, 2, 2]})

# extract needed data to form a list data
p = results["Parent Name"] .to_list()
n = results["Control Name"].to_list()
c = results["Count"]       .to_list()
# parents requiere "" parents with 0 val, but can't have duplicates
pRed = results["Parent Name"].drop_duplicates().to_list()
    
# make plot grid and set plot types acordingly
fig = subplots.make_subplots(rows=1, cols=2, specs=[[{"type": "pie"}, {"type": "pie"}]])

fig.add_sunburst(
    parents = ["" for _ in pRed] + p,   # parent list, parents of parents are ""
    labels  =              pRed  + n,   # data lable list
    values  = [ 0 for _ in pRed] + c,    # values, parents have 0
    ids     = [a + '/' + b if a != "" else b for a, b in zip(["" for _ in pRed] + p, pRed  + n)],    # ids to avoid conflict
    row=1, col=1
)
# this second plot is to be replaced by a different type of plot later
fig.add_sunburst(
    parents = ["" for _ in pRed] + p,   # parent list, parents of parents are ""
    labels  =              pRed  + n,   # data lable list
    values  = [ 0 for _ in pRed] + c,    # values, parents have 0
    ids     = [a + '/' + b if a != "" else b for a, b in zip(["" for _ in pRed] + p, pRed  + n)],    # ids to avoid conflict
    row=1, col=2
)
# show plots
fig.show()
Jack Pote
  • 21
  • 5