I am quite new to using iris so I apologize for the newbie question. I'm trying to interpolate GRIB temperature data at a certain point with known latitude and longitude.
For example, I've downloaded a GRIB file for air temperature over 2 days, hourly, converted in celsius degrees:
air_temperature / (celsius)         (time: 48; latitude: 21; longitude: 31)
    Dimension coordinates:
        time                             x             -              -
        latitude                         -             x              -
        longitude                        -             -              x
    Auxiliary coordinates:
        forecast_period                  x             -              -
    Scalar coordinates:
        height                      2 m
        originating_centre          European Centre for Medium Range Weather Forecasts
Now, I made a daily mean of temperature, so the new cube has 2 values of temperature:
iris.coord_categorisation.add_day_of_year(temperature, "time")
daily_Tmean = temperature.aggregated_by(["day_of_year"], iris.analysis.MEAN)
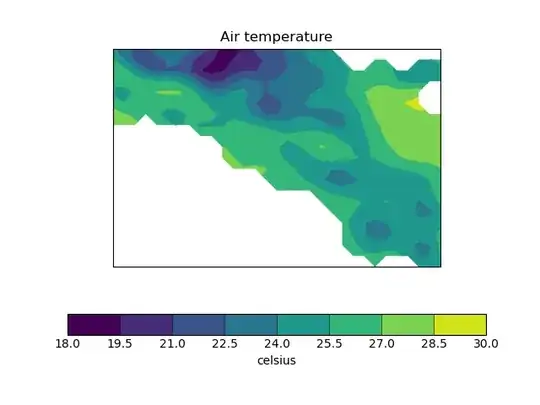
The new temperature values are calculated over the entire area (latitude and longitude) of original GRIB file:
temperature_iter = daily_Tmean.slices(("latitude", "longitude"))
ani = animate.animate(temperature_iter, qplt.contourf)
plt.show()
Now, I'm trying to calculate a new temperature value at given latitude and longitude interpolating the temperatures already calculated as daily mean. What I am trying to achieve is something like "resizing" the pixel resolution. I did this before in MatLab and R applying Delanauy triangulation (https://it.mathworks.com/help/matlab/ref/delaunay.html)
With iris I tried this:
ws_coords = [("latitude", 40.94), ("longitude", 14.02)]
t_atCoords = daily_Tmean.interpolate(ws_coords, iris.analysis.Nearest())
But when I print the calculated temperature values I have this (no Delanauy triangulation so far):
print(t_atCoords.data)
[-- --]
I am quite sure there is something I did not understand or doing wrong, Any help or suggestions would be very much appreciated. Many thanks.