Two Chartjs posts in one day!? Sorry.
Is there anyway to add vertical scrolling, but with your X Axis sticked? The idea here is that if I have 8 or more bars (or depending on the height) on my stacked bar chart, that I could scroll through all of them.
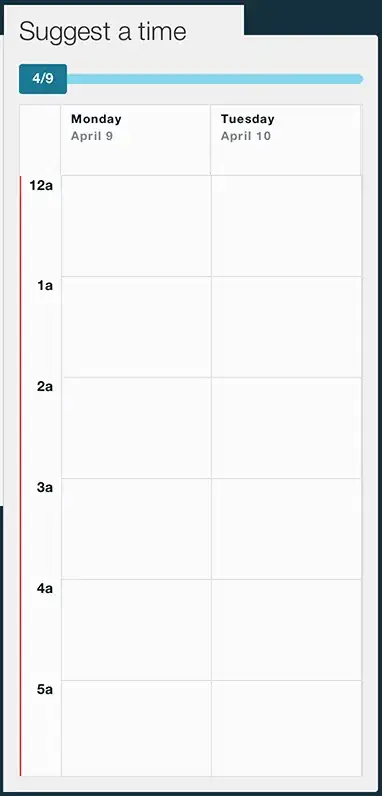
This is an image from the design:
Now, in order for my app to be responsive, I have the responsive: true line in there, which is not the best idea for this sort of thing, since it actually makes the chart no longer render. So would I need to put a hardcoded height and width in there for this to work? Is what I thought, so I added a hardcoded width and it just shows two datasets, the first and last.
Is there anyway to have this vertical scroll with a stick bottom x axis? I figure I can just change the background color of the x axis for when it scrolls down, but I can't even get to that step yet.
I made a CodeSandbox to test this.
I also did a little bit of digging to see if anyone had found anything and there's nothing super enlightening that I could find.
I did find this post, but I was unable to make it work for the x axis for a vertical scroll, not horizontal that the example shows: Make y-axis sticky when having horizontal scroll on chartJS and Angular
Also, I am getting a weird element showing up in the top left corner of my chart. I cannot make out what it is and cannot inspect it. Any ideas of what this is?

Any tips or advice would be greatly appreciated!
Cheers!
