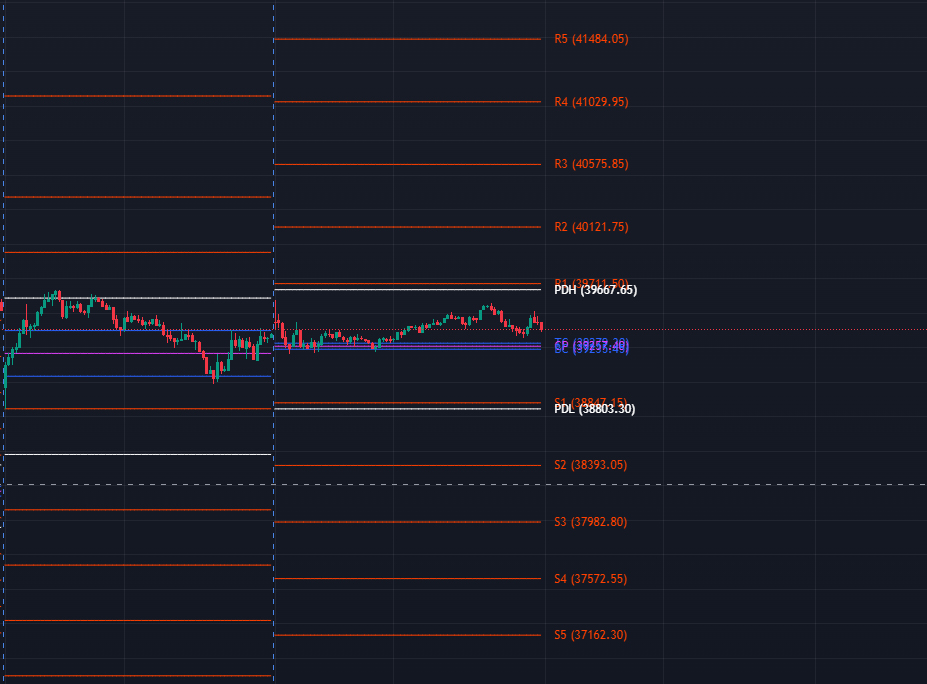
Guys I need help to add labels in script. Now the indicator is showing labels for today only.
How do we enable labels for all previous days? When we tried using plotchar parameter, labels showing correctly for all previous days. But, I don't want to use the plotchart in this script. Which code need to use see previous day labels?
Here is the code
// This source code is subject to the terms of the Mozilla Public License 2.0 at https://mozilla.org/MPL/2.0/
// © pbghosh

//@version=5
indicator(title='Daily CPR', shorttitle='D-CPR', overlay=true, format=format.price, precision=2)

blue = color.blue
fuchsia = color.fuchsia
white = color.white

var color_TC = input.color(defval=color.new(blue, 0), title='TC', group='CPR')
var color_CP = input.color(defval=color.new(fuchsia, 0), title='CP', group='CPR')
var color_BC = input.color(defval=color.new(blue, 0), title='BC', group='CPR')
var color_R1 = input.color(defval=color.new(#FF4000,0), title='R1', group='CPR')
var color_R2 = input.color(defval=color.new(#FF4000 ,0), title='R2', group='CPR')
var color_R3 = input.color(defval=color.new(#FF4000, 0), title='R3', group='CPR')
var color_R4 = input.color(defval=color.new(#FF4000, 0), title='R4', group='CPR')
var color_R5 = input.color(defval=color.new(#FF4000,0), title='R5', group='CPR')
var color_S1 = input.color(defval=color.new(#FF4000,0), title='S1', group='CPR')
var color_S2 = input.color(defval=color.new(#FF4000, 0), title='S2', group='CPR')
var color_S3 = input.color(defval=color.new(#FF4000, 0), title='S3', group='CPR')
var color_S4 = input.color(defval=color.new(#FF4000,0), title='S4', group='CPR')
var color_S5 = input.color(defval=color.new(#FF4000,0), title='S5', group='CPR')
var color_PDH = input.color(defval=color.new(white, 0), title='PDH', group='CPR')
var color_PDL = input.color(defval=color.new(white, 0), title='PDL', group='CPR')


h = request.security(syminfo.tickerid, 'D', high[1], lookahead=barmerge.lookahead_on)
l = request.security(syminfo.tickerid, 'D', low[1], lookahead=barmerge.lookahead_on)
c = request.security(syminfo.tickerid, 'D', close[1], lookahead=barmerge.lookahead_on)

showlabel = true
drawlabel(level, title, color) => label.delete(label.new(bar_index, level, title + " " + "(" + str.tostring(level, format.mintick) + ")", color=#00000000, style=label.style_label_left, textcolor=color)[1])

notHigherTimeframe = timeframe.period != '30' and timeframe.period != '45' and timeframe.period != '60' and timeframe.period != '120' and timeframe.period != '180' and timeframe.period != '240' and timeframe.period != 'D' and timeframe.period != 'W' and timeframe.period != 'M'

calculatePivot() =>
    (h + l + c) / 3

calculateBC() =>
    (h + l) / 2

calculateTC() =>
    calculatePivot() - calculateBC() + calculatePivot()

truncate(number, decimals) =>
    factor = math.pow(10, decimals)
    int(number * factor) / factor
    //round(number * 10) / 10

pivot = calculatePivot()
tc = calculateTC()
bc = calculateBC()

if tc < bc
    t = tc
    tc := bc
    bc := t
    bc

r1Level = truncate(2 * pivot - l, 2)
r2Level = truncate(pivot + h - l, 2)
r3Level = truncate(h + 2 * (pivot - l), 2)
r4Level = truncate(h + 3 * (pivot - l), 2)
r5Level = truncate(h + 4 * (pivot - l), 2)
s1Level = truncate(2 * pivot - h, 2)
s2Level = truncate(pivot - (h - l), 2)
s3Level = truncate(l - 2 * (h - pivot), 2)
s4Level = truncate(l - 3 * (h - pivot), 2)
s5Level = truncate(l - 4 * (h - pivot), 2)

plot(series=notHigherTimeframe ? truncate(tc, 2) : na, title='TC', color=color.new(color_TC, pivot[1] != pivot and notHigherTimeframe ? 100 : 0), style=plot.style_line, linewidth=1)
plot(series=notHigherTimeframe ? truncate(pivot, 2) : na, title='CP', color=color.new(color_CP, pivot[1] != pivot and notHigherTimeframe ? 100 : 0), style=plot.style_line, linewidth=1)
plot(series=notHigherTimeframe ? truncate(bc, 2) : na, title='BC', color=color.new(color_BC, pivot[1] != pivot and notHigherTimeframe ? 100 : 0), style=plot.style_line, linewidth=1)
plot(series=notHigherTimeframe ? r1Level : na, title='R1', color=color.new(color_R1, pivot[1] != pivot and notHigherTimeframe ? 100 : 0), style=plot.style_line, linewidth=1)
plot(series=notHigherTimeframe ? r2Level : na, title='R2', color=color.new(color_R2, pivot[1] != pivot and notHigherTimeframe ? 100 : 0), style=plot.style_line, linewidth=1)
plot(series=notHigherTimeframe ? r3Level : na, title='R3', color=color.new(color_R3, pivot[1] != pivot and notHigherTimeframe ? 100 : 0), style=plot.style_line, linewidth=1)
plot(series=notHigherTimeframe ? r4Level : na, title='R4', color=color.new(color_R4, pivot[1] != pivot and notHigherTimeframe ? 100 : 0), style=plot.style_line, linewidth=1)
plot(series=notHigherTimeframe ? r5Level : na, title='R5', color=color.new(color_R5, pivot[1] != pivot and notHigherTimeframe ? 100 : 0), style=plot.style_line, linewidth=1)
plot(series=notHigherTimeframe ? s1Level : na, title='S1', color=color.new(color_S1, pivot[1] != pivot and notHigherTimeframe ? 100 : 0), style=plot.style_line, linewidth=1)
plot(series=notHigherTimeframe ? s2Level : na, title='S2', color=color.new(color_S2, pivot[1] != pivot and notHigherTimeframe ? 100 : 0), style=plot.style_line, linewidth=1)
plot(series=notHigherTimeframe ? s3Level : na, title='S3', color=color.new(color_S3, pivot[1] != pivot and notHigherTimeframe ? 100 : 0), style=plot.style_line, linewidth=1)
plot(series=notHigherTimeframe ? s4Level : na, title='S4', color=color.new(color_S4, pivot[1] != pivot and notHigherTimeframe ? 100 : 0), style=plot.style_line, linewidth=1)
plot(series=notHigherTimeframe ? s5Level : na, title='S5', color=color.new(color_S5, pivot[1] != pivot and notHigherTimeframe ? 100 : 0), style=plot.style_line, linewidth=1)
plot(series=notHigherTimeframe ? h : na, title='PDH', color=color.new(color_PDH, pivot[1] != pivot and notHigherTimeframe ? 100 : 0), style=plot.style_line, linewidth=1)
plot(series=notHigherTimeframe ? l : na, title='PDL', color=color.new(color_PDL, pivot[1] != pivot and notHigherTimeframe ? 100 : 0), style=plot.style_line, linewidth=1)

if showlabel and timeframe.isintraday
    drawlabel(truncate(tc, 2), title='TC', color=color_TC)
    drawlabel(truncate(pivot, 2), title='CP', color=color_CP)
    drawlabel(truncate(bc, 2), title='BC', color=color_BC)
    drawlabel(r1Level, title='R1', color=color_R1)
    drawlabel(r2Level, title='R2', color=color_R2)
    drawlabel(r3Level, title='R3', color=color_R3)
    drawlabel(r4Level, title='R4', color=color_R4)
    drawlabel(r5Level, title='R5', color=color_R5)
    drawlabel(s1Level, title='S1', color=color_S1)
    drawlabel(s2Level, title='S2', color=color_S2)
    drawlabel(s3Level, title='S3', color=color_S3)
    drawlabel(s4Level, title='S4', color=color_S4)
    drawlabel(s5Level, title='S5', color=color_S5)
    drawlabel(h, title='PDH', color=color_PDH)
    drawlabel(l, title='PDL', color=color_PDL)