1

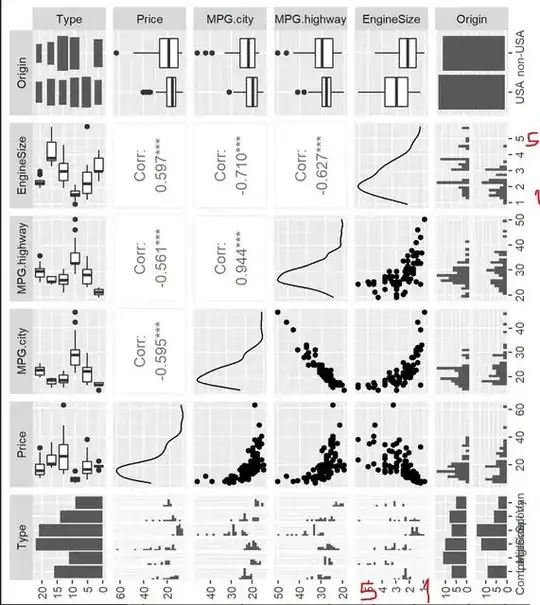
Okay so I'm trying to make a scatterplot matrix with ggpairs (see example below). But I want the whole matrix to be rotated counter-clockwise 90 degrees. And with this, I then want to rotate the axis text. Anytime I try to add any theme() onto ggpairs() and try to display the plot, I get NULL. Please help, this should be simple.

library(dplyr)
library(ggplot2)
library(GGally)
library(MASS)
cars <- dplyr::select(Cars93, Type, Price, MPG.city, MPG.highway, 
              EngineSize, Origin)
ggpairs(cars)

Matrix as it is now

matrix as it is now

What I want the matrix to look like
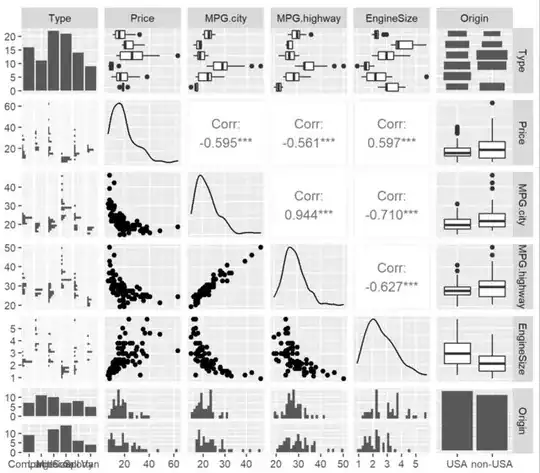
what I want matrix to look like

Kat
  • 15,669
  • 3
  • 18
  • 51
hsandborn
  • 11
  • 3

2 Answers2

0

This isn't exactly the same as your image, but I think this is what you're looking for.

ggpairs(cars,
        upper = list(continuous = "points", combo = "facethist", 
                     discrete = "facetbar", "na"),
        lower = list(continuous = "cor", combo = "box_no_facet", 
                     discrete = "count", "na"),
        diag = list(na = "naDiag", discret = "barDiag", 
                    continuous = "densityDiag"))

The bottom and top row are swapped from what you asked for, but the orientation is what you were looking for (I think!).

enter image description here

Kat
  • 15,669
  • 3
  • 18
  • 51
0

You can use the function viewport from grid in a print call to turn your object 90 like this:

library(dplyr)
library(ggplot2)
library(GGally)
library(MASS)
library(grid)
cars <- dplyr::select(Cars93, Type, Price, MPG.city, MPG.highway, 
                      EngineSize, Origin)
p <- ggpairs(cars)
print(p, vp=viewport(angle=90, width = unit(4.5, "inches"), height = unit(4.5, "inches")))

Created on 2022-08-16 by the reprex package (v2.0.1)

Quinten
  • 35,235
  • 5
  • 20
  • 53