4

I thought Adding Points, Legends and Text to plots using xts objects would have the answer to this question, but apparently not...

require(quantmod)
getSymbols("SAM")
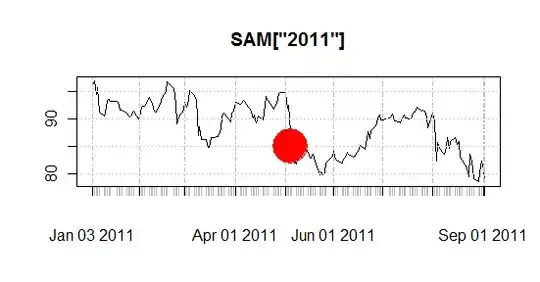
big.red.dot <- zoo(85, as.Date("2011-05-05"))
plot(SAM['2011'])
points(  big.red.dot, col="red", pch=19, cex=5  )

This one seems to be straight out of the textbook. ?plot.zoo doesn't contain any examples with point() though.

Community
  • 1
  • 1
isomorphismes
  • 8,233
  • 9
  • 59
  • 70
  • @Joshua Ulrich Thank you for correcting the title (and writing the package!). The sequence of title edits make it clear that I don't understand the difference between `plot.zoo`, `plot.xts`, and "`quantmod` plot", if the last one exists. Could you point me to a reference please? – isomorphismes Sep 06 '11 at 04:51
  • 1
    @Lau Tzu: `plot` is a generic function. `plot.zoo` and `plot.xts` are simply methods for zoo and xts class objects. See `?plot.zoo` and `?plot.xts` for descriptions of each respective function. quantmod has the `chartSeries` plotting function. – Joshua Ulrich Sep 06 '11 at 17:02
  • @isomorphismes I should have looked at `Methods(plot)` as well to understand how `plot` (the generic one) works. Also http://adv-r.had.co.nz/OO-essentials.html#s3 – isomorphismes Jun 25 '15 at 17:37

1 Answers1

10

By default the objects created by quantmod::getSymbols are in fact of class xts. This means your big.red.dot should be a xts object:

big.red.dot <- xts(85, as.Date("2011-05-05"))
plot(SAM['2011'])
points(  big.red.dot, col="red", pch=19, cex=5  )

enter image description here

Joshua Ulrich
  • 173,410
  • 32
  • 338
  • 418
Andrie
  • 176,377
  • 47
  • 447
  • 496