df_clip2_types = left_join(df_clip2, types) %>% na.omit()

fname <- dps[i]
fname1 <- paste0(fname, ".pdf")
pdf(file = fname1)

p_ag_cover <- ggplot() +
   geom_raster(data = df_clip2_types, aes(x = x, y = y, fill = cropgroup, group = cropgroup)) +
   scale_fill_manual(
     limits = c( "nuts", "smgrains", "fruit", "hay", "potatoes", "rice", "cotton", "fallow", "grapes", "veg", "corn", "othercrops", "Open Water", "Pasture", "other", "N/A"),
     labels = c( "Nuts", "Small grains", "Fruit", "Hay", "Potatoes", "Rice", "Cotton", "Fallow cropland", "Grapes", "Vegetables", "Corn", "Other crops", "Open Water", "Pasture", "other", "N/A"),
     values = c( "darkgoldenrod", "goldenrod", "darkred", "darkgreen", "black",  "violet","pink", "grey", "purple", "lightgreen", "gold", "lightblue", "darkblue", "springgreen3", "antiquewhite1", "dark grey")) + labs(title = fname) + background_grid() + theme(
       panel.background = element_rect(fill = "grey")
     )

plot(p_ag_cover, asp = 2)

dev.off()
Hello, I am plotting a raster using geom_raster() .
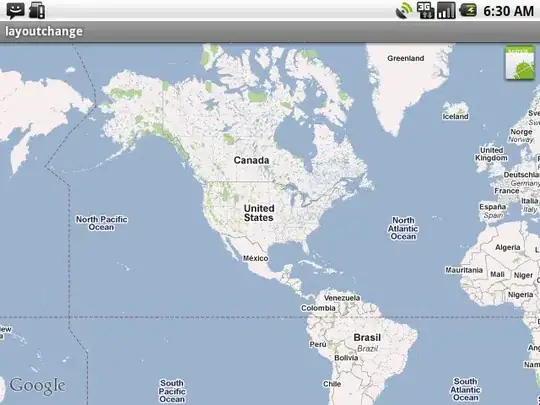
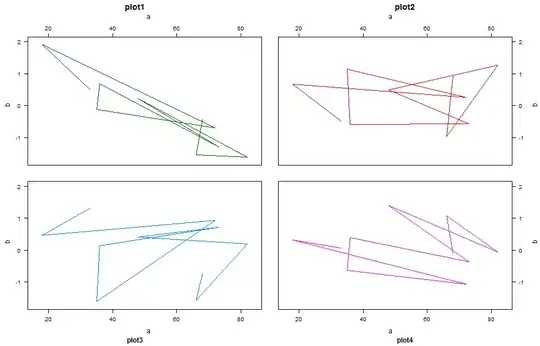
However, when I create a plot/export to PDF, I notice that the dimensions of the raster are distorted, and that instead of looking like it should (dimension-wise) on the left, the image looks like the right (too wide and short.
I am new to R and would appreciate any help. I've also attached the code here. I've tried changing asp values.
Raster plot that I am trying to replicate
aster plotting output that I get with my code, it's too short and wide
Scale that I want to achieve with raster plotting


