I am trying to get something like this, where the style of the chart goes from a color on the min value to a color on the max value, and the progress value is in between.
I have this code:
option = {
    tooltip: {
        formatter: '{a} <br/>{b} : {c}%'
    },
    series: [{
        name: 'Pressure',
        type: 'gauge',
        max: 40,
        min: -10,
        startAngle: 180,
        endAngle: 0,

        progress: {
            show: true,
            itemStyle: {
                color: {
                    type: 'linear',
                    x: 0,
                    y: 1,
                    x2: 1,
                    y2: 1,
                    colorStops: [{
                        offset: 0,
                        color: "blue"
                    }, {
                        offset: 0.25,
                        color: "blue"
                    }, {
                        offset: 0.5,
                        color: "green"
                    }, {
                        offset: 0.75,
                        color: "orange"
                    }, {
                        offset: 1,
                        color: "red"
                    }],
                    global: false // default is false
                }
            }
        },
        pointer: {
            show: false
        },

        detail: {
            valueAnimation: true,
            formatter: '{value}'
        },
        data: [{
                // name of date item
                name: 'data1',
                // value of date item is 8
                value: 10,
            },
            // {
            //     name: 'data2',
            //     value: 40,
            //     // user-defined label format that only useful for this data item
            //     label: {},
            //     // user-defined special itemStyle that only useful for this data item
            //     itemStyle:{},
            //     anchor: {
            //       show: false
            //     },
            //     progress: {
            //       itemStyle: {
            //         color: 'black'
            //       }
            //     },
            //     title: {
            //       show: false
            //     },
            //     detail: {
            //       show: false
            //     },
            // }
        ]
    }]
};
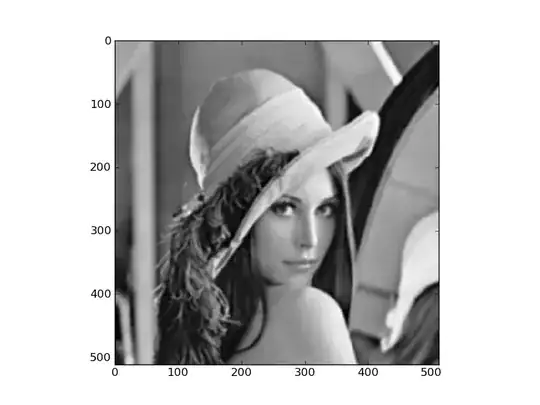
Which gives the close to what I want but not really as you can see the range of colors apply up to the current value. To test this paste the code in here:
https://echarts.apache.org/examples/en/editor.html?c=gauge-simple
The result:
Another solution is to draw the entire axis line with this gradient color and cover the right side after the progress value but not sure how to do this.


