1

I want to display text information in a graphics plot via textplot(), however text is cut. Does anybody know how to make it fit?

library(gplots)

str <- as.character("R is a programming language for statistical computing and graphics supported by the R Core Team and the R Foundation for Statistical Computing. Created by statisticians Ross Ihaka and Robert Gentleman, R is used among data miners, bioinformaticians and statisticians for data analysis and developing statistical software.[6] Users have created packages to augment the functions of the R language.

According to user surveys and studies of scholarly literature databases, R is one of the most commonly used programming languages used in data mining.[7] As of March 2022, R ranks 11th in the TIOBE index, a measure of programming language popularity, in which the language peaked in 8th place in August 2020")

textplot(str, halign = c("right"),
         valign = c("bottom"), cex=0.5, fixed.width=TRUE,
         cspace=1, lspace=1, mar=c(0, 0, 3, 0) + 0.1,
         tab.width = 8)
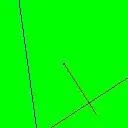
enter image description here

  • 1
    you could add `str <- paste(strwrap(str, width = getOption('width')), collapse = '\n')` play around with the value of `width` to get the line width you want – rawr Jun 16 '22 at 11:21

2 Answers2

0

Edit: You could use legend in base R plot like this:

str <- as.character("R is a programming language for statistical computing and graphics supported by the R Core Team and \n the R Foundation for Statistical Computing. Created by statisticians Ross Ihaka and Robert Gentleman, \n R is used among data miners, bioinformaticians and statisticians for data analysis and developing statistical software.[6] \n Users have created packages to augment the functions of the R language.

According to user surveys and studies of scholarly literature databases, R is one of the most \n commonly used programming languages used in data mining.[7] As of March 2022, R ranks 11th in the TIOBE index, \n a measure of programming language popularity, in which the language peaked in 8th place in August 2020")

par(mar = c(0,0,0,0))
plot(c(0, 1), c(0, 1), ann = F, bty = 'n', type = 'n', xaxt = 'n', yaxt = 'n')
legend(0, 0.75, legend = c(str), cex = 0.5, bty = "n")

Output:

enter image description here

Old edit: An option is adding \n to your string to create enters and use annotate with ggplot like this:

str <- as.character("R is a programming language for statistical computing and graphics supported by the R Core Team and \n the R Foundation for Statistical Computing. Created by statisticians Ross Ihaka and Robert Gentleman, \n R is used among data miners, bioinformaticians and statisticians for data analysis and developing statistical software.[6] \n Users have created packages to augment the functions of the R language.

According to user surveys and studies of scholarly literature databases, R is one of the most \n commonly used programming languages used in data mining.[7] As of March 2022, R ranks 11th in the TIOBE index, \n a measure of programming language popularity, in which the language peaked in 8th place in August 2020")

library(ggplot2)
ggplot() +
  annotate("text", x = 4, y = 25, size = 3, label = str) +
  theme_void()

Output:

enter image description here

Quinten
  • 35,235
  • 5
  • 20
  • 53
0

From the documentation:

cex

Character size, see par for details. If unset, the code will attempt to use the largest value which allows the entire object to be displayed.

Edit: New solution based on comments.

str <- gsub('(.{1,80})(\\s|$)', '\\1\n', as.character("R is a programming language for statistical computing and graphics supported by the R Core Team and the R Foundation for Statistical Computing. Created by statisticians Ross Ihaka and Robert Gentleman, R is used among data miners, bioinformaticians and statisticians for data analysis and developing statistical software.[6] Users have created packages to augment the functions of the R language.

According to user surveys and studies of scholarly literature databases, R is one of the most commonly used programming languages used in data mining.[7] As of March 2022, R ranks 11th in the TIOBE index, a measure of programming language popularity, in which the language peaked in 8th place in August 2020"))

textplot(str, halign = c("right"),
         valign = c("top"), fixed.width=F,
         mar=c(0, 0, 3, 0) + 0.1,
         tab.width = 8)

Output:

enter image description here

koolmees
  • 2,725
  • 9
  • 23