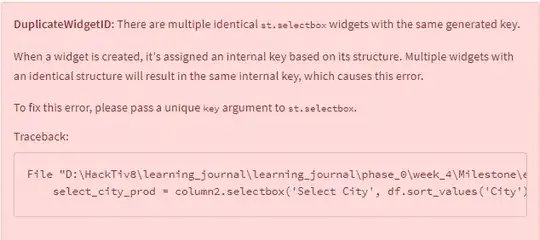
so i want to make callback graph that can display the graph within theres two widget there (radio and selectbox), but i have some problem in here, the radio button (gender clasify) theres no change when i choose the gender, the graph still stay at same graph, and i want to input the selectbox with variable of the 'City' but theres somethin error message "DuplicateWidgetID"
this is my code:
with st.expander('Favorite product by Gender within city'):
        column1, column2 = st.columns([3,1])
        #Variables
        #male_product = df[df['gender'] == 'Male'].groupby(['product_line','gender']).count()['quantity'].sort_values(ascending=False).reset_index()
        #female_product = df[df['gender'] == 'Female'].groupby(['product_line','gender']).count()['quantity'].sort_values(ascending=False).reset_index()


    #Callback
    selected_gender = st.radio('What is your Gender:', ['Male', 'Female'], index = 0)
    select_city = column2.selectbox('Select City', df.sort_values('City').City.unique())
    male_product=px.histogram(df.sort_values('product_line') ,x='product_line', y='gross_income', color = 'product_line',)
    female_product=px.histogram(df.sort_values('product_line') ,x='product_line', y='gross_income', color = 'product_line',)

    if selected_gender == 'Male':
        st.write('What men buy most!')
        st.plotly_chart(male_product, use_container_width=True)
    else:
        st.write('What female buy most!')
        st.plotly_chart(female_product, use_container_width=True)
but theres will be error when i entry "select_city" to the code and theres will be notification like this:
thanks for your attention, and can someone help me.


