8

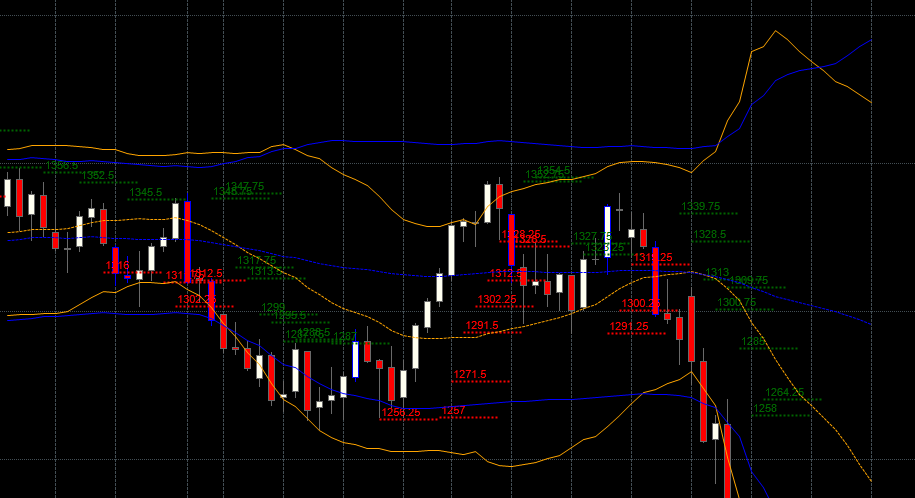
I would like to produce a plot like this https://stat.ethz.ch/pipermail/r-sig-finance/attachments/20110826/19da3834/attachment.png using quantmod.

I am a bit frustrated with, I guess, a very simple task. I would like to be able to draw a line on the chart using quantmod. After several days of trying I am getting nowhere. I can not see an example on how to do that with quantmod::addLines function (this is the only similar question I found but could not find an answer on it http://r.789695.n4.nabble.com/quantmod-plot-trendline-td894632.html)

My problem is this: I would like to plot a horizontal line at specified date/time/bar nad y value. This line is only allowed to be n (for example 5) bars long starting at some specific bar (additionally I would also like to add the text just above the line of the y value specified).

I have tried several things:

getSymbols("SPY")

lines.SPY <- (Hi(SPY) + Lo(SPY))/2
names(lines.SPY) <- c("lines")
lines.SPY$BuySell <- ifelse(lag(lines.SPY$lines) > lines.SPY$lines, 1, -1)

chartSeries(SPY, subset="2011-08::", theme=chartTheme('white',
up.col='blue', dn.col='red'))
addTA(lines.SPY$lines[lines.SPY$BuySell == -1,], type='p', col='darkred', pch="_", on=1, cex = 2.5)
addTA(lines.SPY$lines[lines.SPY$BuySell == 1,], type='p', col='green4', pch="_", on=1, cex = 2.5)

But this are not actually lines... And I do not know ow to add text...

Then I have tried this

getSymbols("SPY")

subset = "2011-03::"

dev.new()
chartSeries(SPY, subset=subset, theme="white")
test <- xts(rep(coredata(last(Cl(SPY))), 20), order.by=index(last(SPY, n=20)))
addTA(test, on=1, col="red", legend=NULL, lwd=3)

Again, adding text is not possible. The other problem with this approach is that I can not get rid off the legend at the top. Since I want to draw tens or hundreds of those lines on one chart legend should not be displayed...

Thanks in advance for your ideas/code examples/...

Best regards, Samo.

IRTFM
  • 258,963
  • 21
  • 364
  • 487
Samo
  • 2,065
  • 20
  • 41
  • I received a good answer/solution https://mailman.stat.ethz.ch/pipermail/r-sig-finance/2011q3/008425.html . Thanks. – Samo Aug 30 '11 at 22:40

1 Answers1

3

(I'm just copying in the answer from R-sig-finance, by Stergios Marinopoulos) Use the new chart_Series() function, along with text and segments.

require(quantmod) 
getSymbols("SPY") 
chart_Series(SPY, subset="2011-08::", type = "candlesticks" ) 
text(9, 112.00, "SOME TEXT", adj=0); 
segments(9, 111.5, 12, 111.5) ; 

Some additional commentary by me. To add a message: text(x,y,"message") where x is the number of the bar (1 for the leftmost bar; you can use 0 or negative to draw off the left side), and y is the value in the chart. For adj, 0 means left-align, 1 means right-align, 0.5 means centre it. Outside the 0..1 range shifts it over accordingly (but perhaps unwise to rely on that).

segments(x1,y1,x2,y2) draws a line from (x1,y1) to (x2,y2), where again x is a bar index and y is a price.

The following draws an isosceles triangle, in 20% opaque red: polygon( c(20,30,40), c(5290,5320,5290), col="#ff000033")

I.e. all the R graphics functions are available; but you must use chart_Series().

Darren Cook
  • 27,837
  • 13
  • 117
  • 217
  • Darren, thnx. I have a problem with this approach when I embed your code inside of a function require(quantmod) getSymbols("SPY") drawSomething<-function() { chart_Series(SPY, subset="2011-08::", type = "candlesticks" ) text(9, 112.00, "SOME TEXT", adj=0); segments(9, 111.5, 12, 111.5) ; } drawSomething() If I do so I get Error in text.default(9, 112, "SOME TEXT", adj = 0) : plot.new has not been called yet . I Understand that using plot(chart_series(...)) solves the problem but I have hundreds of lines, texts and add_TA so it takes ages replotting... How to handle this? – Samo Dec 18 '11 at 10:35
  • @Samo The error message is a distraction, as the problem is the previous line. When you use a function that creates a plot in a function you have to print it. I.e. change your first line to `print(chart_Series(SPY, subset="2011-08::", type = "candlesticks" ) )` – Darren Cook Dec 19 '11 at 04:40
  • Do you maybe have a solution for this http://stackoverflow.com/questions/8639928/issue-with-quantmod-add-ta-and-chart-series-lines-and-text-disappear-after-nex question I posted? – Samo Dec 27 '11 at 17:46