I can't seem to make my dashboard and the main problem is in the dropdown and the plot (bar chart). I have tried most of the stuffs but I still can't figure out what's the problem. Does anyone know what's wrong with my code? The 'population' is basically the 'native country'.
I uploaded my data here: https://github.com/standatagithub/cpsdata/blob/main/cpsdata.csv
This is my code:
import dash
from jupyter_dash import JupyterDash  # pip install dash
import dash_core_components as dcc
import dash_html_components as html
import pandas as pd
import plotly.graph_objs as go
from dash.dependencies import Input, Output

df = pd.read_csv(r'C:\Users\mrsta\OneDrive\Desktop\cpsdata.csv')

app = JupyterDash()


#AppLayout
app.layout = html.Div([

            html.H1("Population in a city", style={'text-align': 'center'}),

            dcc.Dropdown(
                id='population-dropdown',
                options=[{'label': i, 'value': i} for i in list(df.Native_Country_of_Father.unique())],
                placeholder="Please select..",
                searchable=True
            ),

            dcc.Slider(
                id='year-slider',
                min=df['Year'].min(),
                max=df['Year'].max(),
                value=df['Year'].min(),
                step=None,
                marks={str(Year): str(Year) for Year in df['Year'].unique()}
            ),

            dcc.Graph(id='graph-with-slider'),


        ],
        style={'width': '48%', 'display': 'inline-block'})


#App CallBack

@app.callback(
    Output('graph-with-slider', 'figure'),
    [Input('year-slider', 'value'),
     Input('population-dropdown','value')])

#Figure Update

def update_figure(selected_year, selected_population):
    filtered_df = df[df['Native_Country_of_Father']] == selected_population
    filtered_df = filtered_df[filtered_df.Year == selected_year]
    traces = []
    for i in df.Native_Country_of_Father.unique():
        df_by_population = filtered_df[filtered_df['selected_population'] == i]
        traces.append(go.Bar(
             x=df_by_population['City'],
             y=df_by_population['Native_Country_of_Father'], #Numberofpopulation
             text=df_by_continent['City'],
             barmode='stack'),
            name=i
        )

    return {
        'data': traces,
        'layout': go.Layout(
            margin={'l': 40, 'b': 40, 't': 10, 'r': 10},
            legend={'x': 0, 'y': 1},
            hovermode='closest'
        )
    }


if __name__ =='__main__':
    app.run_server(mode="external")
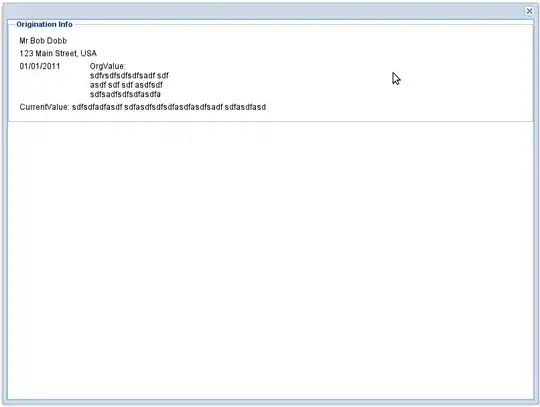
This is my dataframe and the error message I received:
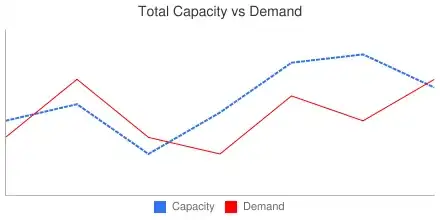
This is how I think my output should look like. I crop and edited this image from multiple sources.
