2

With plotly on R, I have a bubble scatter plot and I want to add black text on each bubble. I also have my bubbles colored following a column of my data frame (Type: Yes or No). On my legend, when I click on "Yes" it will remove the bubbles linked to "Yes" but the text is staying, even if I added a 'legendgroup=~Type' in both traces.

How can I remove the text linked to the bubble when the user click on the legend ? It is possible but only if I set 'color = ~Type' in my text trace, but I want to keep the text in black.

Example :

df <- data.frame(Projet=c("A", "B", "C"), x=c(0.2, 0.4, 0.6), y=c(0.6, 0.5, 0.1), Size=c(2,5,8), Type=c("Yes", "Yes", "No"))

fig <- plot_ly(df, x = ~ x, y = ~y) %>%
  add_trace(color = ~Type, size = ~Size,
            type = 'scatter', mode = 'markers', 
            sizes = c(20, 80),
            marker = list(symbol = 'circle', sizemode = 'diameter',line = list(width = 2, color = 'gray60')),
            hovertext = ~paste('Projet:', Projet, '<br>Size (kE):', Size),
            hoverinfo="text", legendgroup=~Type) %>%
  add_trace(type="scatter", mode="text", text=~Projet, showlegend=F, legendgroup=~Type)


fig

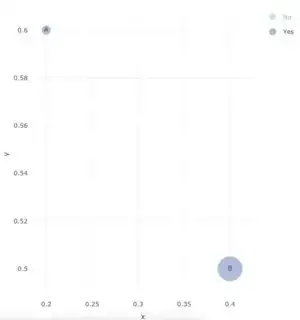
Which gives :

enter image description here

And if I click on "Yes" in the legend : enter image description here

=> I want to remove the "A" and "B" text in this case

Thanks !
Chika
  • 1,455
  • 2
  • 16
  • 24

1 Answers1

2

When I looked at your Plotly object, you assigned three group names to the parameter legendgroup. The reason it worked in your initial call add_trace is that Plotly will split a trace by color. In your call for text, everything is the same color, so it didn't automatically split the trace.

In your call for the text, you need to add split to split the trace.

Check it out

library(plotly)

df <- data.frame(Project = c("A", "B", "C"), x = c(0.2, 0.4, 0.6),
                 y = c(0.6, 0.5, 0.1), Size = c(2,5,8), 
                 Type = c("Yes", "Yes", "No"))

fig <- plot_ly(df, x = ~ x, y = ~y) %>%
  add_trace(color = ~Type, size = ~Size,
            type = 'scatter', mode = 'markers', 
            sizes = c(20, 80),
            marker = list(symbol = 'circle', sizemode = 'diameter',
                          line = list(width = 2, color = 'gray60')),
            hovertext = ~paste('Project:', Project, '<br>Size (kE):', Size),
            hoverinfo = "text", legendgroup = ~Type) %>%
  add_trace(type = "scatter", mode = "text", text = ~Project, 
            showlegend = F, legendgroup = ~Type, split = ~Type) # <- I'm new!

fig

enter image description here enter image description here

enter image description here

Kat
  • 15,669
  • 3
  • 18
  • 51
  • Great answer Kat! – stats_noob May 06 '22 at 00:43
  • 1
    Can you please check this out? https://stackoverflow.com/questions/64655646/r-display-popup-information-when-mouse-hovers-over-graph-visnetwork thanks! – stats_noob May 06 '22 at 01:25
  • @stats_noob - answered it... it's been a year and a half! I can't believe that it went unanswered. The visNetwork instructions are kind of a hot mess! Although there are an astronomical amount of things you can do with it, so I wouldn't want the job of trying to organize that! So... it's perfect, not a hot mess at all. (eek) – Kat May 06 '22 at 03:18