Code:
library(plotly)
library(tidyverse)

df <- data.frame(protein = c("Chicken", "Beef", "Pork", "Fish",
                             "Chicken", "Beef", "Pork", "Fish"),
                 y1 = c(3, 24, 36, 49, 7, 15, 34, 49),
                 y2 = c(9, 28, 40, 47, 8, 20, 30, 40 ),
                 gender = c("Male", "Male", "Male", "Male",
                            "Female", "Female", "Female", "Female"))

df %>%
  plot_ly() %>%
  add_bars (y = ~y1, x = ~protein,
            name = 'y1.male') %>% add_bars(y = ~y2,
               x=~protein, color = I("green"),name = "y2.male")%>%
  add_bars(y = ~y1, x = ~protein, color = I("black"),
           name = 'y1.female') %>% add_bars(y = ~y2,
                x=~protein, color = I("red"), name = "y2.female")
My desired result is to create something similar to this:
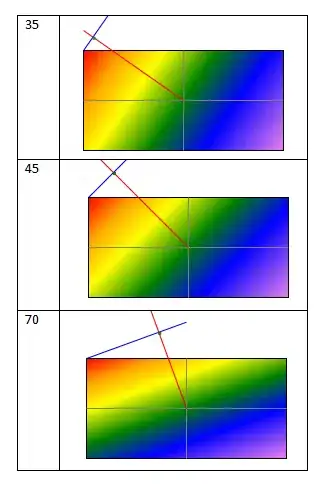
However when you run the code, you'll see that it has stacked the "Male" and "Female" values in each bar. I would like "y1.male" to represent the "Male" data when y = y1, "y2.male" to represent the "Male" data when y = y2, "y1.female" to represent the "Female" data when y = y1, and "y2.female" to represent the "Female" data when y = y2, respectively. How can I go about doing this without having to use filter by "transforms" in r-plotly?