I am trying to access the customdata assigned to each data point via the javascrit (for instance to assign an hyperlink to each point). However, I noticed that the data format changes from one plot to the other, which seems bizarre.
This works perfectly in this example (based on this post), that is when the fill aesthetic is a character vector:
library(plotly)
library(htmlwidgets)

js <- "function(el, x) {
         el.on('plotly_click', function(d) {
           console.log(d);
           console.log(d.points[0].data.customdata[0]);
       });
       }"

X <- data.frame(x = c(1, 2, 1, 2), y = c(1, 1, 2, 2), z = as.character(1:4), mydata = letters[1:4])

gg <- ggplot(X, aes(x = x, y = y, customdata = mydata)) + geom_tile(aes(fill = z))

ggplotly(gg) %>% onRender(js)
 As can be seen, a single and correct custom data shows up when clicking on each point. The structure of the customdata is similar to other plots.
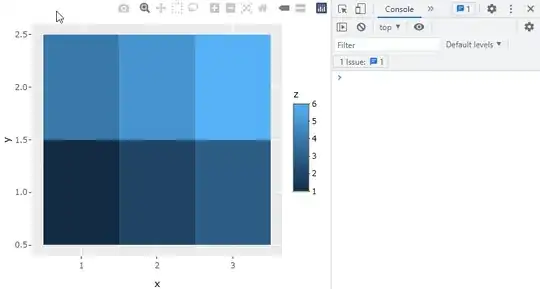
However, when z is entered as a numerical variable, the structure of the customdata behaves bizarrely:
X <- data.frame(x = c(1, 2, 1, 2), y = c(1, 1, 2, 2), z = 1:4, mydata = letters[1:4])

gg <- ggplot(X, aes(x = x, y = y, customdata = mydata)) + geom_tile(aes(fill = z))

ggplotly(gg) %>% onRender(js)
 Is this a bug? How can I fix this? In fact, my dataset is much larger than the one in this example.
Edit
@ismirsehregal provided a solution that works for the above example. However, it seems that customdata takes the vector data as is, which seems quite wrong. Therefore, if we change the order of X the js script stop working.
Showcase:
library(plotly)
library(htmlwidgets)

js <- "function(el, x) {
         el.on('plotly_click', function(d) {
           var zdimensions = [ 0, 0 ];
           var vecindex = 0;
           var clickedcustomdata = '';

           var zdimensions = [ d.points[0].data.z.length, d.points[0].data.z[0].length ];
           vecindex = d.points[0].pointIndex[0]*zdimensions[1] + d.points[0].pointIndex[1];
           clickedcustomdata = d.points[0].data.customdata[vecindex];
           console.log(d);
           console.log(clickedcustomdata);
         });
       }"

X <- data.frame(x = c(1, 2, 3, 1, 2, 3),
                y = c(1, 1, 1, 2, 2, 2),
                z = 1:6,
                mydata = letters[1:6])

X <- X[order(-X$z),]

gg <- ggplot(X, aes(x = x, y = y, customdata = mydata)) + geom_tile(aes(fill = z))
fig <- ggplotly(gg) %>% onRender(js)
fig
I guess a potential solution would be to previously order X in R so it matches the matrix order?

