I have this data:
s_result = [{'time': array([ 0. , 0.1, 0.2, ..., 299.7, 299.8, 299.9]), 'I': array([10., 10., 10., ..., 0., 0., 0.]), 'S': array([60., 60., 60., ..., 0., 0., 0.]), 'M': array([40., 40., 40., ..., 0., 0., 0.]), 'R': array([0., 0., 0., ..., 1., 1., 1.]), 'P1': array([ 0., 0., 0., ..., 19., 19., 19.]), 'D1': array([ 0., 0., 0., ..., 81., 81., 81.]), 'P2': array([0., 0., 0., ..., 0., 0., 0.]), 'D2': array([0., 0., 0., ..., 0., 0., 0.]), 'P3': array([0., 0., 0., ..., 0., 0., 0.]), 'D3': array([0., 0., 0., ..., 0., 0., 0.]), 'P4': array([0., 0., 0., ..., 0., 0., 0.]), 'D4': array([0., 0., 0., ..., 0., 0., 0.]), 'P5': array([0., 0., 0., ..., 0., 0., 0.]), 'D5': array([0., 0., 0., ..., 0., 0., 0.]), 'P6': array([0., 0., 0., ..., 0., 0., 0.]), 'D6': array([0., 0., 0., ..., 0., 0., 0.]), 'P7': array([0., 0., 0., ..., 0., 0., 0.]), 'D7': array([0., 0., 0., ..., 0., 0., 0.]), 'P8': array([0., 0., 0., ..., 0., 0., 0.]), 'D8': array([0., 0., 0., ..., 0., 0., 0.]), 'P9': array([0., 0., 0., ..., 0., 0., 0.]), 'D9': array([0., 0., 0., ..., 0., 0., 0.])}, {'time': array([ 0. , 0.1, 0.2, ..., 299.7, 299.8, 299.9]), 'I': array([10., 10., 10., ..., 0., 0., 0.]), 'S': array([60., 60., 60., ..., 0., 0., 0.]), 'M': array([40., 40., 40., ..., 0., 0., 0.]), 'R': array([0., 0., 0., ..., 0., 0., 0.]), 'P1': array([ 0., 0., 0., ..., 20., 20., 20.]), 'D1': array([ 0., 0., 0., ..., 80., 80., 80.]), 'P2': array([0., 0., 0., ..., 0., 0., 0.]), 'D2': array([0., 0., 0., ..., 0., 0., 0.]), 'P3': array([0., 0., 0., ..., 0., 0., 0.]), 'D3': array([0., 0., 0., ..., 0., 0., 0.]), 'P4': array([0., 0., 0., ..., 0., 0., 0.]), 'D4': array([0., 0., 0., ..., 0., 0., 0.]), 'P5': array([0., 0., 0., ..., 0., 0., 0.]), 'D5': array([0., 0., 0., ..., 0., 0., 0.]), 'P6': array([0., 0., 0., ..., 0., 0., 0.]), 'D6': array([0., 0., 0., ..., 0., 0., 0.]), 'P7': array([0., 0., 0., ..., 0., 0., 0.]), 'D7': array([0., 0., 0., ..., 0., 0., 0.]), 'P8': array([0., 0., 0., ..., 0., 0., 0.]), 'D8': array([0., 0., 0., ..., 0., 0., 0.]), 'P9': array([0., 0., 0., ..., 0., 0., 0.]), 'D9': array([0., 0., 0., ..., 0., 0., 0.])}, {'time': array([ 0. , 0.1, 0.2, ..., 299.7, 299.8, 299.9]), 'I': array([10., 10., 10., ..., 0., 0., 0.]), 'S': array([60., 60., 60., ..., 0., 0., 0.]), 'M': array([40., 40., 40., ..., 0., 0., 0.]), 'R': array([0., 0., 0., ..., 0., 0., 0.]), 'P1': array([ 0., 0., 0., ..., 20., 20., 20.]), 'D1': array([ 0., 0., 0., ..., 80., 80., 80.]), 'P2': array([0., 0., 0., ..., 0., 0., 0.]), 'D2': array([0., 0., 0., ..., 0., 0., 0.]), 'P3': array([0., 0., 0., ..., 0., 0., 0.]), 'D3': array([0., 0., 0., ..., 0., 0., 0.]), 'P4': array([0., 0., 0., ..., 0., 0., 0.]), 'D4': array([0., 0., 0., ..., 0., 0., 0.]), 'P5': array([0., 0., 0., ..., 0., 0., 0.]), 'D5': array([0., 0., 0., ..., 0., 0., 0.]), 'P6': array([0., 0., 0., ..., 0., 0., 0.]), 'D6': array([0., 0., 0., ..., 0., 0., 0.]), 'P7': array([0., 0., 0., ..., 0., 0., 0.]), 'D7': array([0., 0., 0., ..., 0., 0., 0.]), 'P8': array([0., 0., 0., ..., 0., 0., 0.]), 'D8': array([0., 0., 0., ..., 0., 0., 0.]), 'P9': array([0., 0., 0., ..., 0., 0., 0.]), 'D9': array([0., 0., 0., ..., 0., 0., 0.])}]
I intend to work on only M as follows:
for index in range(0, 3):
    x_stochastic = s_result[index]['M']
    x_stochastic=((s_result['M'][0]-s_result['M'][:])/s_result['M'][0])
    plt.plot(s_trajectory['time'],x_stochastic , 'r')
    plt.xlabel('Time')
    plt.ylabel('Monomer Conversion,X')
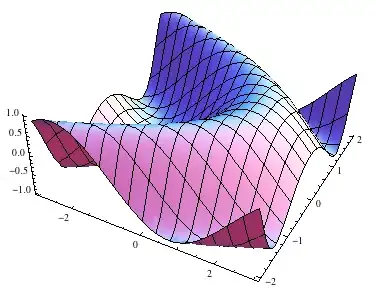
The expected outcome is 3 different trajectories as shown in the above data. But this is what got graphically:

