0

I am quite new to Qlik and I am trying to make a measure that counts different categories for outputing a bar graph with the count of each category on said graph. Anyone know how to do this? Dataframe

Right now I am processing the raw data on Alteryx to output this, not sure if there is a way to couple the two programs.

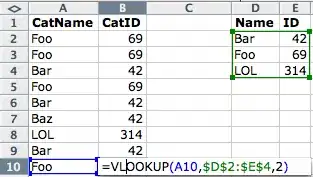
I tried something like: Count({<Category={'Feature'}>}Category), but it does not really work. I will post a sample to help clarify how my df looks like and the graph that I need to output.

Bar Graph output nested by category

  • It's not clear what you are trying to count as there does not appear to be a `Category` field in your data. – Professor Pantsless Mar 28 '22 at 13:23
  • Each field is a `Category` , and each unique value on this `Category` is a `Feature`. – tiagoeng Mar 29 '22 at 00:46
  • I don't think there is a straight forward way to do this. You can get the field names using the system field `$Field`, but it does not really link to the data in a meaningful way for what you want to achieve. – Professor Pantsless Mar 31 '22 at 13:48

0 Answers0