1

Given a dataset:

x = [3, 2, 4, 6, 7]
y = ['a','a','b','b','c']

Here variables a and b are repeated twice. My requirement is to plot the bar graph for each variable and for variables a and b, we need a separate bar for each a and b.

I was trying to plot a horizontal bar graph using the code:

plt.barh(y, x)
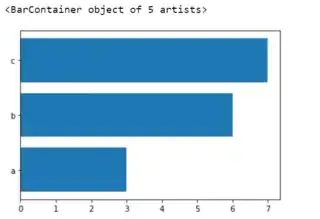
Horizontal Barplot of dataset

Here the value of a and b are stacked and plotted in a single bar. Please help with this.
mozway
  • 194,879
  • 13
  • 39
  • 75
rijulml
  • 21
  • 3
  • I could not understand the requirement of your question correctly. So if you need to plot a bar graph based upon the repetition of the variables in `y`, what do you need `x` for? – TheFaultInOurStars Mar 09 '22 at 09:22
  • x is the value associated on the x-axis with each value of y I want to plot. I don't want to count the number of times a specific value in y has appeared @AmirhosseinKiani – rijulml Mar 09 '22 at 09:24
  • @AlexisG, No I don't think so. The link you have shared is to plot two different bars on the same axis without an overlap which is a different case. Thanks. – rijulml Mar 09 '22 at 09:26

1 Answers1

1

You can plot on a range and change the tick labels:

x = [3, 2, 4, 6, 7]
y = ['a','a','b','b','c']

import matplotlib.pyplot as plt
plt.barh(range(len(x)), x)
plt.yticks(range(len(x)), y)

output:

enter image description here

mozway
  • 194,879
  • 13
  • 39
  • 75