Here are some reasons why your app might be using more memory than expected, even with an empty activity:
Base Memory Overhead: Even an empty Android app has some baseline memory overhead due to the Android operating system and the necessary runtime components. This baseline memory usage can vary based on the Android version and device specifications.
Native Libraries: The native code you mentioned in the profiler might be libraries or components that are being loaded by your app. Some libraries, especially those used in third-party SDKs, can consume significant amounts of memory.
Resources and Assets: While your activity might not have any views or specific tasks, your app could still be loading resources and assets like images, fonts, and other files. These resources are loaded into memory when the app starts.
Java/Kotlin Objects: The Java/Kotlin runtime and the Android framework itself create objects and data structures behind the scenes to manage the app's lifecycle, UI components, and other functionalities. These objects consume memory, even in an empty activity.
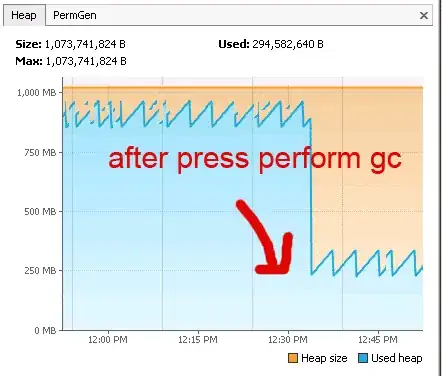
Garbage Collection: The garbage collector in Android might not have run yet when you checked the memory usage, or it might not have released all the unused memory at that moment. Garbage collection is a non-deterministic process, and it might happen at different times during app execution.
Instruments Overhead: The Android Profiler itself may introduce some overhead while measuring memory usage, which can impact the reported numbers.
Caching and Optimization: Android OS and various components use caching and optimization techniques to improve performance. This can temporarily increase memory usage.

