I have a dataframe that looks like this:
data = {'QA Score': [0, 0.5, 1, 1.5, 2, 2.5, 3, 3.5, 4, 4.5, 5, 5.5, 6, 6.5, 7],
   'Scopus': [0,0,0,0,0,1,0,0,1,3,2,3,6,4,2],
   'ResearchGate': [0,0,0,0,0,0,1,1,2,3,2,1,0,2,1],
   'Taylor&Francis': [0,0,0,0,0,0,0,0,0,1,0,0,2,0,0],
   'ACM': [0,0,0,0,1,1,3,3,0,4,2,5,0,0,0]
  }
df = pd.DataFrame(data)
I would like to create a stacked bar plot with the numbers of the column 'QA score' as xticks.
Right now I have got this plot:
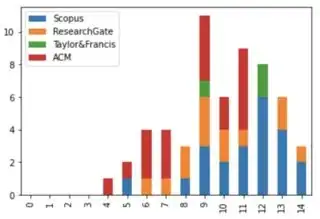
The x axis from 0 to 14 should be set to 0 to 7 with steps of 0.5 (as in column 'QA score')
I tried resetting the index with df.set_index(['QA Score']) and tried plt.xticks() but it all does not work.
Anyone has an idea how to do this? Thanks in advance!
